 TEMPE, Ariz. — August 1, 2025 — Economic activity in the manufacturing sector contracted in July for the fifth consecutive month, following a two-month expansion preceded by 26 straight months of contraction, say the nation’s supply executives in the latest Manufacturing ISM® Report On Business®.
The report was issued today by Susan Spence, MBA, chair of the Institute for Supply Management® (ISM®) Manufacturing Business Survey Committee:
“The Manufacturing PMI® registered 48 percent in July, a 1-percentage point decrease compared to the 49 percent recorded in June. The overall economy continued in expansion for the 63rd month after one month of contraction in April 2020. (A Manufacturing PMI above 42.3 percent, over a period of time, generally indicates an expansion of the overall economy.) The New Orders Index contracted for the sixth month in a row following a three-month period of expansion; the figure of 47.1 percent is 0.7 percentage point higher than the 46.4 percent recorded in June. The July reading of the Production Index (51.4 percent) is 1.1 percentage points higher than June’s figure of 50.3 percent. The Prices Index remained in expansion (or ‘increasing’) territory, registering 64.8 percent, down 4.9 percentage points compared to the reading of 69.7 percent reported in June. The Backlog of Orders Index registered 46.8 percent, up 2.5 percentage points compared to the 44.3 percent recorded in June. The Employment Index registered 43.4 percent, down 1.6 percentage points from June’s figure of 45 percent.
“The Supplier Deliveries Index indicated faster delivery performance after seven consecutive months in expansion (or ‘slower’) territory. The reading of 49.3 percent is down 4.9 percentage points from the 54.2 percent recorded in June. (Supplier Deliveries is the only ISM Report On Business® index that is inversed; a reading of above 50 percent indicates slower deliveries, which is typical as the economy improves and customer demand increases.) The Inventories Index registered 48.9 percent, down 0.3 percentage point compared to June’s reading of 49.2 percent.
“The New Export Orders Index reading of 46.1 percent is 0.2 percentage point lower than the reading of 46.3 percent registered in June. The Imports Index registered 47.6 percent, 0.2 percentage point higher than June’s reading of 47.4 percent.”
Spence continues, “In July, U.S. manufacturing activity contracted at a faster rate, with declines in the Supplier Deliveries and Employment Indexes contributing as the biggest factors in the 1-percentage point loss of the Manufacturing PMI.
“The demand indicators improved, with the New Orders and Backlog of Orders indexes contracting at slower rates, while the Customers’ Inventories and New Export Orders indexes contracted at slightly faster rates. A ‘too low’ status for the Customers’ Inventories Index is usually considered positive for future production.
“Regarding output, the Production Index increased month over month to move further into expansion territory, however; the Employment Index dropped further into contraction as panelists indicated that managing head count is still the norm at their companies, as opposed to hiring. The mixed indicators in output suggest companies still being cautious in their hiring even with an increase in production.
“Finally, inputs (defined as supplier deliveries, inventories, prices and imports), on net, declined further into contraction territory. The Inventories Index moved marginally further into contraction territory after expanding in April, as companies work to reduce or adjust inventory to better align with demand. The Supplier Deliveries Index indicated faster deliveries as supply chain performance improved and sluggish demand continued. Prices continued to increase, but at a slower rate. The Imports Index remained in contraction but moved upward slightly.
“Looking at the manufacturing economy, 79 percent of the sector’s gross domestic product (GDP) contracted in July, up from 46 percent in June. Notably, 31 percent of GDP is strongly contracting (registering a composite PMI of 45 percent or lower), up from 25 percent in June. The share of sector GDP with a PMI at or below 45 percent is a good metric to gauge overall manufacturing weakness. Of the six largest manufacturing industries, none expanded in July, compared to four in June,” says Spence.
The seven manufacturing industries reporting growth in July — listed in order — are: Apparel, Leather & Allied Products; Plastics & Rubber Products; Nonmetallic Mineral Products; Textile Mills; Miscellaneous Manufacturing; Furniture & Related Products; and Primary Metals. The 10 industries reporting contraction in July — in the following order — are: Printing & Related Support Activities; Paper Products; Chemical Products; Machinery; Wood Products; Fabricated Metal Products; Computer & Electronic Products; Transportation Equipment; Electrical Equipment, Appliances & Components; and Food, Beverage & Tobacco Products.
What Respondents Are Saying
- “Fairly flat quarter over quarter, but with us being in the safety and security sector (and with U.S. Customs and Border Protection as a customer), the recent bill that passed should result in an increase in business in the coming months.” [Computer & Electronic Products]
- “Sales continue at unprecedented growth, driven by data-center construction. Customers and the sales team continue to demand lower pricing, which drives down gross margins in face of input price increases, primarily from aluminum imports.” [Chemical Products]
- “These tariff wars are beginning to wear us out. It’s been very difficult to forecast what we will pay in duties and calculate any cost savings we’ve had this year. Also, tariffs have disrupted our customs import bond. There is zero clarity about the future, and it’s been a difficult few months trying to figure out where everything is going to land and the impact on our business. So far, tremendous and unexpected costs have been incurred.” [Apparel, Leather & Allied Products]
- “Currently, higher interest rates still depress the construction industry for new construction projects. Tariff policies are uncertain, which slows down (1) our investment in new projects, (2) component sourcing for new products, (3) blanket orders and (4) replenishment of large inventory quantities. Instead, we’re working to shift suppliers to lower political risk countries or develop domestic sources. We are impacted by the higher tariffs on costs of raw materials and components both sourced domestically and from overseas, and we expect expenses will be higher in the third and fourth quarters as we consume the inventory received with new and higher tariffs or update costs from domestic sources in the second quarter.” [Machinery]
- “Sales softening more than usual during the summer. Negotiations with non-U.S. manufacturers are strained as we are reluctant to issue POs for deliveries three or more months into the future with prices that include current tariffs.” [Fabricated Metal Products]
- “In the health-care world we continue with ‘business as normal,’ but we are increasingly searching and assessing geopolitical risk mitigation options.” [Miscellaneous Manufacturing]
- “Tariffs are causing complete uncertainty around sourcing strategies. A sit-and-wait game for now.” [Electrical Equipment, Appliances & Components]
- “Sales are about on par with 2024, but nowhere near budget forecast. Tariff concerns seem to be growing as the year progresses.” [Nonmetallic Mineral Products]
- “Business is steady, with solid bookings and backlog. Still uncertainty about tariffs and associated inflation.” [Furniture & Related Products]
- “Energy capacity, specifically in the grid operated by PJM Interconnection, continues to be one of the major concerns for business continuity and growth in this region. The procurement of power and rising natural gas prices in this region due to past green energy policies, coupled with future projected allocations for artificial intelligence data centers, adds additional stress to the PJM system.” [Primary Metals]
- “Cautiously stable. Tariff impacts are still being monitored. Some increases have been implemented while monitoring other products.” [Transportation Equipment]
| MANUFACTURING AT A GLANCE
July 2025 |
| Index |
Series
IndexJul |
Series
IndexJun |
Percentage
Point
Change |
Direction |
Rate of
Change |
Trend*
(Months) |
| Manufacturing PMI® |
48.0 |
49.0 |
-1.0 |
Contracting |
Faster |
5 |
| New Orders |
47.1 |
46.4 |
+0.7 |
Contracting |
Slower |
6 |
| Production |
51.4 |
50.3 |
+1.1 |
Growing |
Faster |
2 |
| Employment |
43.4 |
45.0 |
-1.6 |
Contracting |
Faster |
6 |
| Supplier Deliveries |
49.3 |
54.2 |
-4.9 |
Faster |
From Slower |
1 |
| Inventories |
48.9 |
49.2 |
-0.3 |
Contracting |
Faster |
3 |
| Customers’ Inventories |
45.7 |
46.7 |
-1.0 |
Too Low |
Faster |
10 |
| Prices |
64.8 |
69.7 |
-4.9 |
Increasing |
Slower |
10 |
| Backlog of Orders |
46.8 |
44.3 |
+2.5 |
Contracting |
Slower |
34 |
| New Export Orders |
46.1 |
46.3 |
-0.2 |
Contracting |
Faster |
5 |
| Imports |
47.6 |
47.4 |
+0.2 |
Contracting |
Slower |
4 |
| OVERALL ECONOMY |
Growing |
Slower |
63 |
| Manufacturing Sector |
Contracting |
Faster |
5 |
Manufacturing ISM® Report On Business® data is seasonally adjusted for the New Orders, Production, Employment and Inventories indexes.
*Number of months moving in current direction.
Commodities Reported Up/Down in Price And In Short Supply
Commodities Up in Price
Aluminum (20); Aluminum Products; Brass Products; Copper; Copper Products; Corrugated Boxes (5); Electrical Components (6); Electronic Components (6); Fabricated Metal Components; Freight; Polypropylene; Steel (6); Steel — Stainless (5); Steel Products (5); and Wire Products.
Commodities Down in Price
Corn; Natural Gas; Ocean Freight; and Soybean Meal.
Commodities in Short Supply
Electrical Components, Electronic Components (5); and Rare Earth Magnets.
Note: The number of consecutive months the commodity is listed is indicated after each item.
July 2025 Manufacturing Index Summaries
Manufacturing PMI®
The U.S. manufacturing sector contracted in July for the fifth consecutive month after two months of expansion preceded by 26 months of contraction. “The Manufacturing PMI registered 48 percent, 1 percentage point lower compared to the 49 percent reported in June. Of the five subindexes that directly factor into the Manufacturing PMI, only one (Production) is in expansion territory, down from two in June. The slowing of supplier deliveries in previous months reversed course, with a 4.9-percentage point index decrease indicating a drawdown of manufacturing inventories and easing port congestion. The Employment Index decreased and it remained with New Orders in contraction territory. None of the six biggest manufacturing industries registered growth in July,” says Spence. A reading above 50 percent indicates that the manufacturing sector is generally expanding; below 50 percent indicates that it is generally contracting.
A Manufacturing PMI above 42.3 percent, over a period of time, generally indicates an expansion of the overall economy. Therefore, the July Manufacturing PMI indicates the overall economy grew for the 63rd straight month after contracting in April 2020. “The past relationship between the Manufacturing PMI and the overall economy indicates that the July reading (48 percent) corresponds to a change of plus-1.6 percent in real gross domestic product (GDP) on an annualized basis,” Spence said.
The Last 12 Months
| Month |
Manufacturing
PMI® |
Month |
Manufacturing
PMI® |
| Jul 2025 |
48.0 |
Jan 2025 |
50.9 |
| Jun 2025 |
49.0 |
Dec 2024 |
49.2 |
| May 2025 |
48.5 |
Nov 2024 |
48.4 |
| Apr 2025 |
48.7 |
Oct 2024 |
46.9 |
| Mar 2025 |
49.0 |
Sep 2024 |
47.5 |
| Feb 2025 |
50.3 |
Aug 2024 |
47.5 |
| Average for 12 months – 48.7
High – 50.9
Low – 46.9 |
New Orders
ISM’s New Orders Index contracted in July for the sixth consecutive month after three consecutive months of expansion, registering 47.1 percent, an increase of 0.7 percentage point compared to June’s figure of 46.4 percent. This reading is below the 12-month moving average (48.3 percent) for the New Orders Index, which hasn’t indicated consistent growth since a 24-month streak of expansion ended in May 2022. “Of the six largest manufacturing sectors, none reported increased new orders. Panelists noted continued weak demand, with a 1-to-1.4 ratio of positive comments to those expressing concern about near-term demand. Overall, new orders continue to slow amid tariff uncertainty; which party will pay tariff costs is still the prime issue in negotiations between buyers and sellers,” says Spence. A New Orders Index above 52.1 percent, over time, is generally consistent with an increase in the Census Bureau’s series on manufacturing orders (in constant 2000 dollars).
The four manufacturing industries that reported growth in new orders in July are: Apparel, Leather & Allied Products; Plastics & Rubber Products; Primary Metals; and Miscellaneous Manufacturing. The eight industries reporting a decline in new orders in June, in order, are: Paper Products; Wood Products; Petroleum & Coal Products; Nonmetallic Mineral Products; Fabricated Metal Products; Machinery; Chemical Products; and Computer & Electronic Products. Six industries reported no change in new orders in July.
| New Orders |
%Higher |
%Same |
%Lower |
Net |
Index |
| Jul 2025 |
18.8 |
55.3 |
25.9 |
-7.1 |
47.1 |
| Jun 2025 |
20.5 |
52.2 |
27.3 |
-6.8 |
46.4 |
| May 2025 |
25.0 |
48.1 |
26.9 |
-1.9 |
47.6 |
| Apr 2025 |
28.1 |
45.2 |
26.7 |
+1.4 |
47.2 |
Production
The Production Index continued in expansion territory for the second consecutive month in July, registering 51.4 percent, 1.1 percentage points higher than the June reading of 50.3 percent. Prior to the readings of expansion in January and February, the index was in contraction territory for eight consecutive months, with the previous reading above 50 percent in April 2024 (50.7 percent). Of the six largest manufacturing sectors, two (Petroleum & Coal Products; and Transportation Equipment) reported increased production. “Production levels in July, while improved, remain fragile amid continuing softness in new orders. Panelists had a 1-to-1.2 ratio of positive to negative comments regarding output,” says Spence. An index above 52.1 percent, over time, is generally consistent with an increase in the Federal Reserve Board’s Industrial Production figures.
The seven industries reporting growth in production during the month of July — in the following order — are: Apparel, Leather & Allied Products; Textile Mills; Petroleum & Coal Products; Plastics & Rubber Products; Nonmetallic Mineral Products; Miscellaneous Manufacturing; and Transportation Equipment. The six industries reporting a decrease in production in July, in order, are: Paper Products; Machinery; Fabricated Metal Products; Primary Metals; Electrical Equipment, Appliances & Components; and Chemical Products.
| Production |
%Higher |
%Same |
%Lower |
Net |
Index |
| Jul 2025 |
20.1 |
60.7 |
19.2 |
+0.9 |
51.4 |
| Jun 2025 |
20.7 |
60.6 |
18.7 |
+2.0 |
50.3 |
| May 2025 |
19.1 |
56.3 |
24.6 |
-5.5 |
45.4 |
| Apr 2025 |
19.8 |
56.0 |
24.2 |
-4.4 |
44.0 |
Employment
ISM’s Employment Index registered 43.4 percent in July, 1.6 percentage points lower than June’s reading of 45 percent. “The index posted its sixth consecutive month of contraction after expanding in January, with seven straight months of contraction before that. Since May 2022, the Employment Index has contracted in 32 of 39 months. Of the six big manufacturing sectors, none reported expanded employment in July. For every comment on hiring, there were two on reducing head counts — a fairly wide ratio, historically speaking — reflecting companies’ continuing focus on accelerating staff reductions due to uncertain near- to mid-term demand. Layoffs were the primary measure, an indication that staff shrinking continues to be urgent,” says Spence. An Employment Index above 50.3 percent, over time, is generally consistent with an increase in the Bureau of Labor Statistics (BLS) data on manufacturing employment.
Of the 18 manufacturing industries, three reported employment growth in July: Nonmetallic Mineral Products; Miscellaneous Manufacturing; and Plastics & Rubber Products. The 11 industries reporting a decrease in employment in July, in the following order, are: Textile Mills; Printing & Related Support Activities; Paper Products; Primary Metals; Fabricated Metal Products; Computer & Electronic Products; Machinery; Food, Beverage & Tobacco Products; Electrical Equipment, Appliances & Components; Chemical Products; and Transportation Equipment.
| Employment |
%Higher |
%Same |
%Lower |
Net |
Index |
| Jul 2025 |
12.6 |
62.4 |
25.0 |
-12.4 |
43.4 |
| Jun 2025 |
10.4 |
72.1 |
17.5 |
-7.1 |
45.0 |
| May 2025 |
14.1 |
68.2 |
17.7 |
-3.6 |
46.8 |
| Apr 2025 |
13.1 |
70.7 |
16.2 |
-3.1 |
46.5 |
Supplier Deliveries†
Delivery performance of suppliers to manufacturing organizations was faster in July after seven months of slowing, with the Supplier Deliveries Index registering 49.3 percent, a 4.9-percentage point decrease compared to the reading of 54.2 percent reported in June. Of the six big industries, two (Food, Beverage & Tobacco Products; and Computer & Electronic Products) reported slower supplier deliveries in July. “The findings in July suggest that supply chain performance is improving as demand is slipping downward,” says Spence. A reading below 50 percent indicates faster deliveries, while a reading above 50 percent indicates slower deliveries.
The nine manufacturing industries reporting slower supplier deliveries in July — in the following order — are: Nonmetallic Mineral Products; Furniture & Related Products; Paper Products; Plastics & Rubber Products; Primary Metals; Electrical Equipment, Appliances & Components; Food, Beverage & Tobacco Products; Computer & Electronic Products; and Fabricated Metal Products. The four industries reporting faster supplier deliveries in July are: Miscellaneous Manufacturing; Transportation Equipment; Chemical Products; and Machinery.
| Supplier Deliveries |
%Slower |
%Same |
%Faster |
Net |
Index |
| Jul 2025 |
8.7 |
81.1 |
10.2 |
-1.5 |
49.3 |
| Jun 2025 |
14.7 |
79.0 |
6.3 |
+8.4 |
54.2 |
| May 2025 |
19.1 |
73.9 |
7.0 |
+12.1 |
56.1 |
| Apr 2025 |
16.6 |
77.2 |
6.2 |
+10.4 |
55.2 |
Inventories
The Inventories Index registered 48.9 percent in July, down 0.3 percentage point compared to the reading of 49.2 percent in June. “Of the six big industries, only one (Food, Beverage & Tobacco Products) expanded in July,” says Spence. An Inventories Index greater than 44.5 percent, over time, is generally consistent with expansion in the Bureau of Economic Analysis (BEA) figures on overall manufacturing inventories (in chained 2000 dollars).
Of 18 manufacturing industries, the 10 reporting higher inventories in July — listed in order — are: Apparel, Leather & Allied Products; Textile Mills; Paper Products; Nonmetallic Mineral Products; Primary Metals; Plastics & Rubber Products; Miscellaneous Manufacturing; Fabricated Metal Products; Electrical Equipment, Appliances & Components; and Food, Beverage & Tobacco Products. The five industries reporting lower inventories in July are: Wood Products; Chemical Products; Computer & Electronic Products; Transportation Equipment; and Machinery.
| Inventories |
%Higher |
%Same |
%Lower |
Net |
Index |
| Jul 2025 |
15.2 |
67.2 |
17.6 |
-2.4 |
48.9 |
| Jun 2025 |
15.6 |
64.9 |
19.5 |
-3.9 |
49.2 |
| May 2025 |
15.6 |
63.2 |
21.2 |
-5.6 |
46.7 |
| Apr 2025 |
20.8 |
59.2 |
20.0 |
+0.8 |
50.8 |
Customers’ Inventories†
ISM’s Customers’ Inventories Index registered a reading of 45.7 percent in July, a decrease of 1 percentage point compared to the reading of 46.7 percent in June. “Customers’ inventory levels in July continued to contract and took a step away from ‘about right’ territory,” says Spence. (For more information about the Customers’ Inventories Index, see the “Data and Method of Presentation” section below.)
The three industries reporting customers’ inventories as too high in July are: Wood Products; Miscellaneous Manufacturing; and Transportation Equipment. The 11 industries reporting customers’ inventories as too low in July, in order, are: Textile Mills; Printing & Related Support Activities; Primary Metals; Nonmetallic Mineral Products; Electrical Equipment, Appliances & Components; Fabricated Metal Products; Paper Products; Furniture & Related Products; Chemical Products; Food, Beverage & Tobacco Products; and Machinery.
Customers’
Inventories |
%
Reporting |
%Too
High |
%About
Right |
%Too
Low |
Net |
Index |
| Jul 2025 |
71 |
10.5 |
70.3 |
19.2 |
-8.7 |
45.7 |
| Jun 2025 |
72 |
14.1 |
65.2 |
20.7 |
-6.6 |
46.7 |
| May 2025 |
69 |
9.9 |
69.2 |
20.9 |
-11.0 |
44.5 |
| Apr 2025 |
76 |
11.1 |
70.2 |
18.7 |
-7.6 |
46.2 |
Prices†
The ISM Prices Index registered 64.8 percent in July, decreasing 4.9 percentage points compared to the June reading of 69.7 percent, indicating raw materials prices increased for the 10th straight month (at a slower rate) after a decrease in September. The Prices Index has increased 9.9 percentage points over the past six months. In the last five months, the index reached its highest levels since June 2022, when it registered 78.5 percent. All of the six largest manufacturing industries — Machinery; Chemical Products; Food, Beverage & Tobacco Products; Computer & Electronic Products; Petroleum & Coal Products; and Transportation Equipment, in that order — reported price increases in July. “The Prices Index reading continues to be driven by increases in steel and aluminum prices that impact the entire value chain, as well as tariffs applied to many imported goods. Higher prices were reported by 35.4 percent of respondents in July, down substantially from 45.6 percent in June. The share of respondents reporting higher prices had consistently increased from November 2024 (12.2 percent) to April (49.2 percent), which was the highest level since June 2022 (65.2 percent),” says Spence. A Prices Index above 52.8 percent, over time, is generally consistent with an increase in the Bureau of Labor Statistics (BLS) Producer Price Index for Intermediate Materials.
In July, the 16 industries that reported paying increased prices for raw materials, in order, are: Nonmetallic Mineral Products; Textile Mills; Furniture & Related Products; Primary Metals; Plastics & Rubber Products; Machinery; Wood Products; Electrical Equipment, Appliances & Components; Fabricated Metal Products; Miscellaneous Manufacturing; Chemical Products; Food, Beverage & Tobacco Products; Computer & Electronic Products; Petroleum & Coal Products; Paper Products; and Transportation Equipment. No industries reported paying decreased prices for raw materials in July.
|
Prices |
%Higher |
%Same |
%Lower |
Net |
Index |
| Jul 2025 |
35.4 |
58.8 |
5.8 |
+29.6 |
64.8 |
| Jun 2025 |
45.6 |
48.1 |
6.3 |
+39.3 |
69.7 |
| May 2025 |
45.1 |
48.5 |
6.4 |
+38.7 |
69.4 |
| Apr 2025 |
49.2 |
41.1 |
9.7 |
+39.5 |
69.8 |
Backlog of Orders†
ISM’s Backlog of Orders Index registered 46.8 percent, an increase of 2.5 percentage points compared to the June reading of 44.3 percent, indicating order backlogs contracted for the 34th consecutive month after a 27-month period of expansion that ended September 2022. Of the six largest manufacturing industries, only Food, Beverage & Tobacco Products reported expansion in order backlogs in July. “Continued contraction in both the New Orders and Backlog of Orders indexes means that trade issues and other geopolitical tensions are still at play. Significant improvement shouldn’t be expected until those issues begin to recede,” says Spence.
Of the 18 manufacturing industries, the three that reported growth in order backlogs in July are: Furniture & Related Products; Food, Beverage & Tobacco Products; and Electrical Equipment, Appliances & Components. The eight industries reporting lower backlogs in July — in the following order — are: Paper Products; Nonmetallic Mineral Products; Plastics & Rubber Products; Wood Products; Machinery; Computer & Electronic Products; Fabricated Metal Products; and Chemical Products. Seven industries reported no change in order backlogs.
| Backlog of
Orders |
%
Reporting |
%Higher |
%Same |
%Lower |
Net |
Index |
| Jul 2025 |
89 |
18.3 |
56.9 |
24.8 |
-6.5 |
46.8 |
| Jun 2025 |
91 |
14.9 |
58.7 |
26.4 |
-11.5 |
44.3 |
| May 2025 |
92 |
15.8 |
62.6 |
21.6 |
-5.8 |
47.1 |
| Apr 2025 |
92 |
15.1 |
57.2 |
27.7 |
-12.6 |
43.7 |
New Export Orders†
ISM’s New Export Orders Index contracted in July, registering 46.1 percent, down 0.2 percentage point from June’s reading of 46.3 percent. “Export orders contracted for the fifth consecutive month after growing in January and February. This brief period of expansion followed an ‘unchanged’ status (a reading of 50 percent), preceded by six straight months of contraction. The continued contraction of new export orders could be indicative of ongoing trade friction and dampened demand,” says Spence.
Of the 18 manufacturing industries, the only industry reporting growth in new export orders in July is Furniture & Related Products. The eight industries reporting a decrease in new export orders in July — in the following order — are: Paper Products; Primary Metals; Plastics & Rubber Products; Fabricated Metal Products; Electrical Equipment, Appliances & Components; Chemical Products; Miscellaneous Manufacturing; and Machinery. Eight industries reported no change in new export orders in July.
New Export
Orders |
%
Reporting |
%Higher |
%Same |
%Lower |
Net |
Index |
| Jul 2025 |
71 |
7.5 |
77.2 |
15.3 |
-7.8 |
46.1 |
| Jun 2025 |
75 |
12.1 |
68.3 |
19.6 |
-7.5 |
46.3 |
| May 2025 |
73 |
11.8 |
56.5 |
31.7 |
-19.9 |
40.1 |
| Apr 2025 |
74 |
8.7 |
68.8 |
22.5 |
-13.8 |
43.1 |
Imports†
ISM’s Imports Index remained in contraction for the fourth month in July after expanding for three straight months. The July figure of 47.6 percent is an increase of 0.2 percentage point over the reading of 47.4 percent in June. “Imports are contracting, though at a slower rate. The need to maintain import levels from previous months is lower, due in large part to slackening demand and tariff pricing,” says Spence.
The five industries reporting an increase in import volumes in July are: Textile Mills; Food, Beverage & Tobacco Products; Plastics & Rubber Products; Miscellaneous Manufacturing; and Fabricated Metal Products. The six industries that reported lower volumes of imports in July — in the following order — are: Wood Products; Petroleum & Coal Products; Paper Products; Computer & Electronic Products; Chemical Products; and Machinery. Seven industries reported no change in imports in July.
| Imports |
%
Reporting |
%Higher |
%Same |
%Lower |
Net |
Index |
| Jul 2025 |
86 |
13.3 |
68.5 |
18.2 |
-4.9 |
47.6 |
| Jun 2025 |
86 |
15.3 |
64.2 |
20.5 |
-5.2 |
47.4 |
| May 2025 |
85 |
13.2 |
53.3 |
33.5 |
-20.3 |
39.9 |
| Apr 2025 |
82 |
15.4 |
63.4 |
21.2 |
-5.8 |
47.1 |
†The Supplier Deliveries, Customers’ Inventories, Prices, Backlog of Orders, New Export Orders, and Imports indexes do not meet the accepted criteria for seasonal adjustments.
Buying Policy
The average commitment lead time for Capital Expenditures in July was 173 days, a decrease of two days compared to June. The average lead time in July for Production Materials was 85 days, the same as in June. The average lead time for Maintenance, Repair and Operating (MRO) Supplies was 44 days, a decrease of four days compared to June.
| Percent Reporting |
| Capital
Expenditures |
Hand-to-
Mouth |
30 Days |
60 Days |
90 Days |
6 Months |
1 Year+ |
Average
Days |
| Jul 2025 |
16 |
4 |
10 |
15 |
26 |
29 |
173 |
| Jun 2025 |
17 |
3 |
9 |
13 |
29 |
29 |
175 |
| May 2025 |
18 |
2 |
9 |
14 |
30 |
27 |
171 |
| Apr 2025 |
16 |
4 |
11 |
14 |
28 |
27 |
169 |
| Percent Reporting |
|
| Production
Materials |
Hand-to-
Mouth |
30 Days |
60 Days |
90 Days |
6 Months |
1 Year+ |
Average
Days |
|
| Jul 2025 |
9 |
28 |
22 |
26 |
8 |
7 |
85 |
|
| Jun 2025 |
9 |
22 |
28 |
26 |
9 |
6 |
85 |
|
| May 2025 |
8 |
24 |
30 |
24 |
9 |
5 |
81 |
|
| Apr 2025 |
10 |
24 |
25 |
26 |
9 |
6 |
84 |
|
| Percent
Reporting |
| MRO Supplies |
Hand-to-
Mouth |
30 Days |
60 Days |
90 Days |
6 Months |
1 Year+ |
Average
Days |
| Jul 2025 |
31 |
35 |
17 |
12 |
4 |
1 |
44 |
| Jun 2025 |
32 |
33 |
17 |
11 |
5 |
2 |
48 |
| May 2025 |
31 |
35 |
16 |
10 |
7 |
1 |
47 |
| Apr 2025 |
31 |
33 |
18 |
12 |
5 |
1 |
46 |
Posted: August 5, 2025
Source: Institute for Supply Management
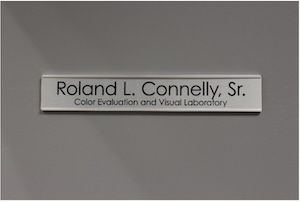 Roland founded RoLyn Group, a consulting service specializing in color and lighting. He served as director of Global Digital Supply Chain for X-Rite Inc. from 2005-2012. Before that, he was the director of Enterprise Color Management at GretagMacbeth, which merged with X-Rite in 2005.