FORT LAUDERDALE, Fla. — August 12, 2025 — Crowley’s latest Avance Class ship, Torogoz, began its inaugural commercial service on Tuesday, departing from Port Everglades, Florida, to serve Central America. The vessel’s commencement is a capstone on the company’s initiation of the four-vessel, Avance Class containership fleet.
Crowley’s fourth Avance Class LNG-powered vessel, Torogoz, begins service.
With a capacity of 1,400 TEUs (20-foot equivalent units), including 300 refrigerated containers, the ship is specifically designed and equipped to quickly and frequently deliver cargo, including apparel, fresh produce, food products, pharmaceuticals and textiles, between the United States and El Salvador, Guatemala, Honduras and Nicaragua.
Torogoz, like the other Avance class vessels, is powered by lower-emission liquefied natural gas (LNG), advancing the company’s next era of faster, frequent ocean shipping that reduces impacts at sea and at port.
“Bringing Torogoz into service to complete the landmark introduction of our Avance Class fleet marks a major milestone in Crowley’s commitment to bringing efficient logistics solutions to customers in Central America and the Caribbean Basin,” said Vice President Claudia Kattan-Jordan, Crowley Logistics for Central America, Panama and Mexico. “Because of Torogoz’s capacity for diverse dry and refrigerated goods, Crowley can provide faster, high-capability service with reliability that is unmatched in the trade.”
The Torogoz follows the operation of its sister ships: Tiscapa, Quetzal and Copán. All four of the Avance Class ships are named to honor the cultural aspects of Central America, where Crowley has operated shipping and logistics services for more than 60 years.
Torogoz, also known as a turquoise-browed motmot, is the national bird of El Salvador. Revered by Mayan and other Mesoamerican civilizations, the bird has likely lived on the continent for thousands of years and has long held spiritual significance in the region.
COLUMBIA, S.C. — August 11, 2025 — Arclin, a materials science company, today announced it is expanding its operations in Dillon County. The company’s more than $60 million investment will create more than 30 new jobs.
Headquartered in Alpharetta, Ga., Arclin is a provider of building solutions and polymer technologies for industries including agriculture, construction, electronics, energy, pharmaceuticals and more. The company operates manufacturing facilities and offices throughout the U.S. and Canada and manufactures for customers worldwide.
The expansion will add 60,000 square feet and a new production line to Arclin’s existing facility, located at 219 Harllees Bridge Road in Dillon, to meet increased customer and market demand.Operations are expected to be online in July 2026. Individuals interested in joining the Arclin team should visit the company’s careers page.
The Coordinating Council for Economic Development approved job development credits related to the project. The council also awarded a $250,000 Rural Infrastructure Fund grant to Dillon County to assist with the costs of site preparation and building construction.
“We are pleased to be expanding our Dillon, S.C., facility, which builds on the success we’ve experienced in this location since 2022,” said Arclin President and CEO Bradley Bolduc. “We are proud to be a part of this community and are excited to continue growing alongside our valuable partners, unlocking a brighter future for everyone.”
“By investing more than $60 million in Dillon County, Arclin is strengthening its commitment to South Carolina and deepening its impact on the local community,” said Governor Henry McMaster. “We applaud the success Arclin has achieved in our state and are proud to celebrate this expansion along with the 30 new jobs it will bring.”
“It is always exciting to see an existing company grow and invest in our state and our people,” said Secretary of Commerce Harry M. Lightsey III. “We look forward to continuing to support Arclin as it furthers its legacy in one of our state’s rural communities, creating additional opportunities in Dillon County and beyond.”
“Dillon County Council is ecstatic about Arclin’s decision to expand their current operations in Dillon County,” added Dillon County Council Chairman Stevie Grice. “We believe an existing industry expansion is one of the highest compliments a county can receive simply because the company has experienced the ability to flourish in an atmosphere we’ve strived hard to create. In Arclin’s case, the company enjoys several successful locations in the USA, and Dillon County was favorably awarded the selection. We will remain vigilant in our efforts to constantly create conducive environments for Arclin and all of our existing industry to thrive in.”
NEW YORK CITY — August 12, 2025 — Lectra — a provider of industrial intelligence technology solutions to players in fashion, automotive and furniture — announced today that Walters, an 85-year-old furniture manufacturer specializing in outdoor furniture for architects and designers, has successfully implemented Lectra’s Furniture on Demand and Valia Furniture platform to dramatically accelerate production workflows and order fulfillment.
The implementation delivered immediate and measurable results. Walters digitized its entire product catalog with Valia Furniture, enabling streamlined production management across both small custom requests and large-scale orders. The transformation has significantly reduced lead times, optimized efficiency, and enhanced customer satisfaction.
“Our experience with Lectra, as a first-time customer, has been very positive: everything from pre-sale to the installation to the follow-up support has been nothing but outstanding,” said Adam Schindler, CEO of Walters. “We chose Furniture on Demand because it was the most advanced platform yet very intuitive and user-friendly.”
Prior to digitizing, Walters was relying on physical patterns. This created challenges of finding the latest pattern and adjusting. Valia Furniture’s digital pattern library has revolutionized Walters’ workflow efficiency. The system eliminates time-consuming manual searches for physical patterns and ensures the latest versions are always accessible. By connecting to all equipment in the cutting room, manufacturers can seamlessly integrate the solution into existing workflows and digitize their production cycle.
“Walters adoption of Lectra’s solutions illustrates how forward-looking manufacturers can connect the dots across the production lifecycle and embrace digital transformation to unlock efficiency and scale,” said Leonard Marano, president of the Americas at Lectra. “With Valia Furniture and Furniture on Demand, companies can accelerate lead teams, reduce manual processes, and future proof operations — without compromising their craftsmanship.”
The implementation has provided Walters with unprecedented visibility into production processes through real-time analytics. This data-driven approach enables smarter, faster decision-making and continuous workflow optimization.
Key benefits achieved:
Accelerated Lead Times – Digitized product catalog enables quick order fulfillment
Enhanced Productivity – Access to digital pattern library simplifies and accelerates locating the latest version of patterns
Optimized Production – Real-time analytics empower data-driven decision-making
Seamless Integration – Complete catalog digitization accomplished in hours, not weeks
This partnership underscores Lectra’s leadership in delivering advanced, industry-specific solutions that enable manufacturers of all sizes to modernize operations and maintain a competitive edge.
SHANGHAI — August 11, 2025 — Industries around the world are transforming to meet modern demands – with technology advancing, markets changing, and sustainability as vital as ever — and the technical textiles and nonwovens sector is no exception. At this year’s Cinte Techtextil China, fringe events will be organized into four key segments to help industry players adapt: Sustainability, Artificial Intelligence, Innovation, and Industry Insight. With an impactful lineup of events, speakers, and product showcases, the organizers expect the array to draw significant interest at the show, taking place September 3-5 at the Shanghai New International Expo Centre.
“It is critical for this industry, which is so often on the cutting-edge of the textile sector, to keep pace with changing environmental regulations and rapidly evolving technology,” said Wilmet Shea, general manager of Messe Frankfurt (HK) Ltd. “That is why we have decided to repackage the show’s comprehensive fringe programme — its four themes are all crucial to the technical textiles and nonwovens sector, and adapting to these will be key for industry players to thrive in the years ahead. Within each category, we are excited to announce insightful topics, displays, and collaborations that showcase the very best the industry has to offer, further promoting the innovation exchange that is a cornerstone of Cinte Techtextil China.”
Key themes highlight insights and business exchange in modern economic climate
Sustainability
Sustainability Forum: taking place in the Econogy Talks seminar area, the forum will address the dual challenges of environmental protection and technological innovation, and outline how manufacturers need to adapt production methods to suit transformation requirements for the sector. Speakers will use insights and practical case studies to show how the integration of technology and design, and innovative business models, can drive the sector towards a greener future.Moderated by Dr Guoxiang Yuan, Graduate Supervisor of Donghua University and Research Fellow of The Hong Kong Polytechnic University, guest speakers include Mr Dominique Simard, Founder & CEO of Rethink Fashion; Ms Jackie Liu, Business Leader from 3M China Limited; and Mr Kinor Jiang, Professor of School of Fashion and Textiles of the Hong Kong Polytechnic University.
Econogy Tour: an insightful tour of independently verified sustainable exhibitors, led by Mr Karl Borgschulze, Managing Director of Consulting Service International. The tour will shine a spotlight on the global companies making positive environmental impacts through innovative product design, production processes, or supply chain management. Combining ‘ecology’ and ‘economy’, Messe Frankfurt’s innovative ‘Texpertise Econogy’ initiative promotes a greener, business-friendly future for the textile industry.
Artificial Intelligence
AI Panel Discussion: focusing on the challenges and opportunities associated with using AI for automated textile material inspection, the panel will offer insights into AI’s enhanced accuracy, reduced labour costs, and real-time inspection capability in high-speed manufacturing environments. Participants include Prof Calvin Wong, CEO & Centre Director of Laboratory for Artificial Intelligence in Design (AiDLab) and Cheng Yik Hung Professor in Fashion of The Hong Kong Polytechnic University; Mr Eric Sham, Senior Consultant at AiDLab; and Ms Dorothy Yeung, Assistant Manager of Business Development at AiDLab (moderator).
Industry Insight
China International Nonwovens Conference (CINC): held for 12 consecutive years, the influential conference is organised by the China National Industries Textile Association (CNITA), and has become an important platform for attendees to understand the global nonwovens market, relating to policies, technological developments, and applications. Featuring a range of high-profile speakers, each session focuses on various companies’ nonwoven or related product advancements and development status, with a strong focus on sustainability and innovation. This year’s conference theme is ‘Breaking the Deadlock and Reconstruction.’
Innovation
Innovation Space: an exhibition area focused on spotlighting the technical textile and nonwoven sector’s cutting-edge advancements. The space serves as a guide to drive industry upgrades, providing visitors with a high-quality showcase of new materials, new products, and new technologies.
Innovation Product Awards and Presentation: the event provides a valuable opportunity for innovators to promote their products to key industry players and potential collaborators, encouraging technological innovation, green development, and high-end applications, and accelerating the adoption of new technology. Outstanding products will be awarded the ‘2025 Innovation Product Award.’
During the three-day fair, other events include various livestreamed tours, focusing on textile application areas such as medical; protective; filtration & separation; automotive; and tent & composite materials. Meanwhile, the ‘Kingsafe Dangs’ National University Students’ Nonwovens Development and Applications Showcase aims to promote and recognise innovation from the next generation. This is set to boost the show’s design and entrepreneurial exchange, with the corresponding awards ceremony giving added visibility to some of the industry’s most promising talents.
Cinte Techtextil China will be held from September 3 – 5, 2025.
The fair is organized by Messe Frankfurt (HK) Ltd; the Sub-Council of Textile Industry, CCPIT; and the China Nonwovens & Industrial Textiles Association (CNITA).
Other upcoming shows:
Intertextile Shanghai Apparel Fabrics – Autumn Edition / Yarn Expo Autumn September 2-4, 2025, National Exhibition and Convention Center (Shanghai)
Posted: August 12, 2025
Source: Messe Frankfurt (HK) Ltd; the Sub-Council of Textile Industry, CCPIT; and the China Nonwovens & Industrial Textiles Association (CNITA)
MANCHESTER, England — August 12, 2025 — Machine learning and AI are now entering the field of textile technology and at this year’s ITMA Asia + CITME exhibition from October 28-31 in Singapore, England-based Shelton Vision will demonstrate how these advanced new disciplines are informing its latest machine vision technology.
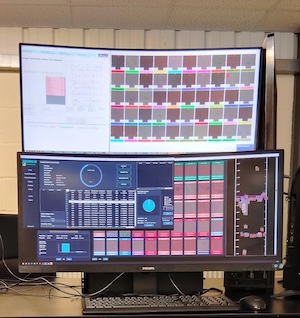
The Shelton Vision stand-alone AI Classifier and review station.
The company is one of a 20-strong delegation of members of the British Textile Machinery Association (BTMA) who will be present at the Singapore exhibition, showcasing advances in technologies for new high performance fibres and fabrics, as well as testing, instrumentation and control in processing.
The ability to detect and classify even the tiniest faults in both plain or fully patterned fabrics which are moving at industrial speeds is significant breakthrough. In Singapore, Shelton Vision will demonstrate its latest machine vision inspection technology which incorporates machine learning to provide a defect detection level of above 98%, and Deep Learning AI to provide up to 100% defect classification and grading accuracy.
Third party adoption
Shelton will also demonstrate a stand-alone AI Classifier in multiple applications used within the Shelton suite of vision system components. This is can be adapted for use with existing third party inspection systems that do not have defect classification (naming) or grading functionality – eliminating subjective manual decisions in day to day operation and vastly increasing the efficiency and throughput of the album review process.
Additionally Shelton will optimised cut plan capability for the Shelton AI Review station or use in the fabric production plants, based on the automated classifier and grading system output which forms a key component in the ROI of the entire system.
“At the show, we will focus on the output data from our vision systems and how this can generate benefit for the whole value chain, including brand, by providing to everyone a reliable source of fabric quality data immediately the fabric is inspected,” explains CEO Mark Shelton. “This results in reduced lead times, reduced fabric waste and increased productivity and efficiency and our patterned fabric inspection system is now already entering new markets such as outdoor upholstery and one piece woven (OPW) airbags, even as the original market of camouflage printing continues to grow.”
Pushing the boundaries
BTMA CEO Jason Kent
“BTMA companies continue to push the boundaries of what’s possible and some of the most recent innovations by our member companies are really going beyond what has previously been possible,” says BTMA CEO Jason Kent. “This year has been extremely productive for our members so far and there will be much to talk about in Singapore.”
BTMA companies taking part in ITMA Asia + CITME 2025 are Airbond (stand A202, Hall 2), Autofoam (B309, Hall 7), AVA CAD/Cam (C210, Hall 6), Cygnet Texkimp (B493, Hall 8), Fibre Extrusion Technology (B306, Hall 4), James Heal (B306, Hall 3), MCL (A203, Hall 5), Roaches (A112 Hall 2), Saurer Fibrevision (C301c, Hall 3), SDC Enterprises (B107, Hall 8), Sellers (B207, Hall 7), Shelton Vision (B308, Hall 7), Slack & Parr (D305, Hall 4), Society of Dyers and Colourists (B203, Hall 3), Strayfield (B509, Hall 7), Tatham (D205, Hall 2), The Textile Institute (B105, Hall 8), Verivide (B201, Hall 3), Vickers Oils (B102, Hall 5) and Wira Instrumentation (A108, Hall 3),
Posted: August 12, 2025
Source: The British Textile Machinery Association (BTMA)
EMIGSVILLE, Pa. — August 12, 2025 — Herculite Products Inc., an innovator and manufacturer of high-performance and custom fabrics, is proud to announce that they have reached 1,000 days with zero lost-time incidents (LTI). This achievement highlights Herculite Associates’ commitment and vigilance in making safety a shared responsibility every single day.
Safety is a core value at Herculite, and this milestone demonstrates the hard work and dedication of every team member in upholding the company’s strict safety standards. Reaching 1000 days without a single LTI is a significant achievement, emphasizing Herculite employees’ commitment to safety procedures, continuous training, and shared safety responsibilities.
Herculite President and CEO Peter McKernan said, “This achievement is not about numbers. It’s about people. It’s about the way we look after one another, the pride we take in doing things safely, and the Herculite culture we have built together — it’s who we are. It is one of the many reasons we have been recognized as one of the Best Places to Work in PA.”
Herculite associates understand that safety is an ongoing process, not just a final goal. Guided by our volunteer-led Safe Pack safety team, Herculite continues to emphasize the importance of safety at home, at work, and throughout the organization through workplace improvements and increased safety awareness.
SEOUL, South Korea — August 12, 2025 — Hyosung TNC will present its largest-ever exhibition booth at Preview in Seoul (PIS) 2025, Korea’s largest textile trade show, to be held at COEX August 20-22. This year marks the 25th edition of the event, which brings together the latest materials and technologies from domestic and global textile and fashion companies, attracting around 500 exhibitors and more than 14,000 visitors.
Hyosung TNC’s joint booth will feature 16 Korean partner companies, including Hyunjin Knit and Ayoung Hightex. To help participating companies achieve tangible business outcomes, Hyosung TNC, in cooperation with the Korea Federation of Textile Industries, has also invited leading global buyers.
“Through our joint booth at PIS 2025, we expect to effectively promote the excellence of K-textiles to the global market,” said Hyosung TNC CEO Kim Chi-Hyung. “We will continue to realize sustainable growth together with our partners and lead the global textile industry.”
The exhibition will be divided into two main zones: the Trend Forum and the Korea Textile Certification Zone.
In the Trend Forum, Hyosung TNC will present trend directions for categories such as outdoor, sports, and loungewear. Reflecting the anticipated fashion trends for 2027, the company will showcase sustainable and high-performance products, including CREORA® Askin, CREORA® Fresh, regen™ Spandex made from recycled materials, and regen™ Ocean Nylon made from recycled fishing nets, along with apparel produced in-house.
The Korea Textile Certification Zone will display products from seven partner companies including Taejin Industrial, Sechang Trading, Yes Textile Consulting Lab, Hyunjin Knit, Boogeon Knit, Haneun Tex, and Woojoo Global, developed using Hyosung TNC’s yarns such as regen™ Polyester and CREORA® Power Fit.
ATLANTA — August 11, 2025 — Softwear Automation, the pioneer in autonomous sewing technology, today announced the successful close of its $20 million Series B1 funding round, marking a major milestone in its mission to revolutionize sewn goods manufacturing. The round was led by a strategic investment from BESTSELLER, the Danish fashion company behind brands such as JACK & JONES, VERO MODA, and ONLY. The investment was made through Invest FWD, BESTSELLER’s dedicated innovation and investment platform for advancing sustainability in the fashion industry. Current investors — including CTW Venture Partners, SRI Capital, MacDonald Ventures — also participated in the financing.
As part of the collaboration between Softwear Automation and BESTSELLER , CFO Thomas Børglum Jensen, on behalf of BESTSELLER, joins the board of Softwear Automation. This at a time of rapid progress towards commercialization of Softwear’s fully automated SEWBOT® worklines.
“This partnership with BESTSELLER and the support from Invest FWD are not just a vote of confidence in our technology — they are a powerful catalyst for the future of on-demand, localized, and more sustainable apparel manufacturing,” said Palaniswamy “Raj” Rajan, chairman and CEO of Softwear Automation.
Softwear Automation’s patented SEWBOT technology delivers a fully autonomous sewing solution, enabling sewn products to be made closer to the consumer, with radically reduced waste, faster cycle times, and superior cost-efficiency. This funding round will accelerate the company’s expansion into new product categories and geographies, deepen its R&D capabilities, and scale its production footprint to meet growing global demand.
From BESTSELLER, CFO Thomas Børglum Jensen added: “At BESTSELLER, we look for innovations that can support progress within the fashion industry, where change is needed. Softwear Automation is helping address some of the key challenges we face across the industry — from speed and flexibility to lowering environmental impact. We’re pleased to support their development and explore how this technology can help us move forward.”
The partnership supports BESTSELLER’s wider efforts to improve its supply chain model with ambitions about reducing environmental impact and increasing transparency.
By leveraging SEWBOT technology, Softwear Automation and BESTSELLER aim to enable more circular and demand-driven production practices.
With this strategic alliance and fresh funding, Softwear Automation is poised to lead the next era of apparel manufacturing — one where fashion is faster, focused on sustainability improvements, and made closer to home.
MUMBAI, India— August 11, 2025 — In a major push to advance circularity and environmental accountability in the technical textiles sector, Techtextil India 2025 will launch the dedicated “ReCycle Zone” in collaboration with the Society of Plastics Engineers India (SPE India). Reclaim, Reuse and Reimagine are among the key features of the zone at the upcoming edition of Techtextil India scheduled November 19-21, 2025, at the Bombay Exhibition Centre, Mumbai.
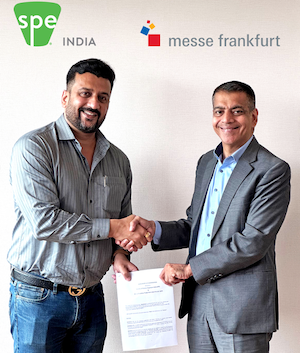
(left to right) Mr. Ramesh Parasuraman – President – Society of Plastics Engineers India & Mr Raj Manek, Executive Director & Board Member, Messe Frankfurt Asia Holdings Ltd.
As industries across the globe adopt circular economy models and sustainable production practices, the ReCycle Zone will serve as a vital platform for stakeholders working to transform textile and plastic waste into value-added materials. The initiative reflects Technical India’s ongoing commitment to driving responsible innovation by converging recyclers, solution providers, machinery manufacturers startups and policy enablers under one roof. This new industry focused zone will spotlight sustainable innovation and next-gen recycling technologies.
Raj Manek, executive director and board member, Messe Frankfurt Asia Holdings Ltd, said: “The ‘ReCycle Zone’ is a timely and strategic addition to Techtextil India. As environmental stewardship becomes central to the industry’s future, this platform will not only spotlight sustainable technologies but also encourage transformative partnerships across the sector.”
Spotlighting on Textile Waste Management and circularity, this ReCycle Zone will host companies specializing in:
Garment, agro-textiles and medical textiles waste recycling
Plastic and PET waste recycling for textile applications
Fibre to fibre and yarn regeneration
Sorting, shredding and advanced recycling machinery
EPR compliance, traceability and green certifications
AI and automation in waste management systems
This initiative aims to bridge the gap between innovation and implementation by connecting buyers, suppliers, R&D specialists and sustainability officers.
To deepen the technical engagement, SPE India will curate a series of focused knowledge sessions and panel discussions within the ReCycle Zone. Experts from academia, policy think tanks and leading corporates will weigh in on topics such as circular product design, industry compliance and mandates, advances in waste recovery, and investment outlook in green tech.
Ramesh Parasuraman, president, Society of Plastics Engineers India, commented: “We are pleased to join forces with Techtextil India to bring ReCycle Zone to life. This platform will go beyond showcasing as it will facilitate critical dialogues, catalyse partnerships and reinforce the importance of science-led scalable recycling solutions across textile and plastics sectors.”
The launch of ReCycle Zone aligns with India’s national efforts towards sustainable manufacturing, driven by programs like LiFE (Lifestyle for Environment) and PM MITRA Parks (Pradhan Mantri Mega Integrated Textile Regions and Apparel). As technical textiles play an increasingly important role across sectors such as defence, healthcare, automotive and agriculture, integrating recycling and circular design into their production processes has become essential.
The zone further reinforces Messe Frankfurt India’s role in nurturing a sustainable business ecosystem through its leading industry platforms. Techtextil India will mark the 10th edition of India’s most comprehensive exhibition for technical textiles, nonwovens, and composites. Organised by Messe Frankfurt Trade Fairs India, the show will cover 12 diverse application areas from protective wear and functional fabrics to smart textiles, filtration and mobility solutions.
Scheduled from November 19-21, 2025, at Bombay Exhibition Centre, Mumbai, the show will bring together global and domestic exhibitors, solutions providers, institutional buyers, research organizations and key industry bodies for three days of business, innovation and networking.
Adding momentum to the industry dialogue the India edition of the Dornbirn Global Fibre Conference one of the most prestigious global conferences for fibre and material innovations, will take place on 18th November 2025 also at NESCO, Mumbai – one day prior to Techtextil India show.
LAHORE, Pakistan — August 11, 2025 — Sapphire Finishing Mills Ltd., one of Pakistan’s leading textile manufacturers, has joined Cascale (formerly the Sustainable Apparel Coalition) as a Corporate Full Member, becoming one of the first few from the country to align with this influential global network committed to responsible manufacturing.
Effective May 2025, the membership expands Sapphire’s access to the complete Higg Index suite of tools, now including the Higg Product Tools, such as the Material Sustainability Index (MSI) and the Product Module (PM). These build on Sapphire’s existing use of the Higg Facility Environmental Module (FEM) and the Facility Social & Labor Module (FSLM), which have guided its sustainability efforts for several years. Collectively, these tools offer a globally recognized, standardized framework for assessing sustainability performance across environmental, social, and product-level dimensions.
“At Sapphire Finishing Mills, sustainability isn’t a checkbox, it’s part of how we operate every day. Joining Cascale gives us the structure and tools to push further, measure better, and drive meaningful change. Representing Pakistan’s textile sector on this platform is both an honor and a responsibility we take seriously.” said Raffay Bin Rauf, Head of Sustainability at Sapphire Finishing Mills Limited.
As a full corporate Cascale member, Sapphire becomes part of a global community of over 300 organizations across 30+ countries, all using the Higg Index to inform strategic decisions, report progress, and drive continuous improvement. Though the tools don’t provide real-time analytics, they deliver consistent, evidence-based reporting that helps companies stay aligned with long-term ESG goals.
For Sapphire, this membership builds on existing efforts already guided by the Higg Facility Tools and now enhanced by access to Product Tools. Key focus areas include:
Low-impact manufacturing and emissions reduction, guided by FEM
Smarter water and chemical usage, informed by Higg scores
Fair labor practices and worker empowerment, aligned with FSLM
Transparency and traceability, now extended through MSI and PM
This milestone marks a step forward not just for Sapphire, but for Pakistan’s broader textile industry, demonstrating that sustainability and innovation can (and must) go hand in hand.
Posted: August 11, 2025
Source: Sapphire Mills — Part Of The Sapphire Group