WATERTOWN, Mass. — July 26, 2021 — Markforged, creator of the integrated metal and carbon fiber additive manufacturing platform, The Digital Forge, announced today it is taking a major strategic step to support aerospace, defense and other manufacturers in highly-regulated industries. Beginning today, Markforged is offering Onyx™ FR-A and Carbon Fiber FR-A, aerospace-ready versions of its Onyx FR and Carbon Fiber FR materials. These two new materials are undergoing a qualification program conducted on the X7 industrial 3D printer by the National Center for Advanced Materials Performance (NCAMP), part of the National institute for Aviation Research (NIAR) at Wichita State University. Upon completion, Markforged is expected to have the first continuous fiber-reinforced additive manufacturing (AM) process qualified by NCAMP, one of two bodies authorized by the Federal Aviation Administration (FAA) to qualify materials for flight.
Since Markforged introduced continuous fiber reinforcement to general manufacturing seven years ago, millions of parts have been printed using The Digital Forge. Markforged is now advancing its support of end-use parts for the aerospace market so manufacturers can benefit from continuous fiber reinforcement technology. This enables manufacturers to take advantage of high strength lightweight composites at lower fixed costs, shorter lead times, and reduced investment in labor compared to traditional processing.
“Markforged believes in a future that is more than metal. We have long supported the aerospace industry and have parts in-flight today,” said Markforged President and CEO Shai Terem. “There is a multi-decade trend underway to transition parts from metals to advanced composites, which are lighter and offer greater efficiencies. Our deliberate move to support innovation in aerospace mitigates risk for these manufacturers and helps get additive parts in the air faster by simplifying the part certification process.”
Markforged has been collaborating with NCAMP since the first quarter of 2020 and has successfully completed the rigorous factory audit phase of the qualification program approved by NIAR and a steering committee consisting of experts spanning commercial and defense industries, academia, and the FAA. The program is currently in the printing and testing phase, which will be followed by an in-depth analysis and reporting cycle. Markforged and NCAMP anticipate full qualification upon completion of these processes in early 2023. Both the FAA and the European Aviation Safety Agency (EASA) currently accept composite specification and design values developed using the NCAMP process.
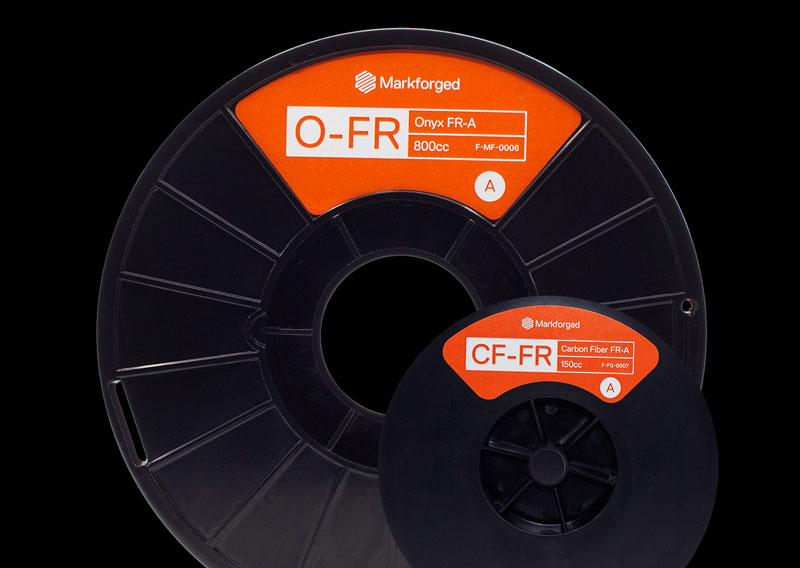
Onyx FR-A and Carbon Fiber FR-A materials are designed to meet Flame, Smoke, and Toxicity (FST) requirements for many parts in aircraft interiors, come with traceability, and adhere to specifications approved by NCAMP. They are specifically developed for end-use applications in demanding industries like aerospace and defense because of their high strength-to-weight ratio, exceptional surface finish, and high consistency. With Onyx FR-A and Carbon Fiber FR-A materials, aerospace manufacturers and others in highly-regulated industries that require higher levels of documentation can more freely explore what’s possible with additive manufacturing and high strength continuous fiber reinforced end-use parts.
Markforged has been working with aerospace customers, such as Cabin Management Solutions (CMS), to bring end-use parts to market through a manual material traceability process. The company, based in Texas, designs and manufactures cabin management and in-flight entertainment systems for business and private aircraft, and has already developed over 100 end-use parts ready to be installed in aircrafts. Newly available material traceability will streamline their processes and, ultimately, help accelerate the path to FAA approval.
“In aerospace, it’s important to have quality parts we can adapt on the fly to make any changes the customer requests,” said Jeff Pike, VP of Engineering at CMS. “Using Markforged printers and materials offers us ways to create low-volume, high-value luxury cabin parts faster and at the point of need. This results in lower costs and accelerated lead times, and with material traceability in place, it will enable us to move even faster in our development process and free up resources to focus elsewhere.”
Onyx FR-A and Carbon Fiber FR-A, available now, will give manufacturers confidence in the materials while reducing risk and saving time. Once Onyx FR-A and Carbon Fiber FR-A complete the NCAMP qualification process, manufacturers will be able to access Markforged’s material information from the NCAMP database, prove equivalency, and have the ability to gain FAA certification efficiently.
Onyx FR-A and Carbon Fiber FR-A materials are available on the Markforged X7, and Onyx FR-A is also available on the Markforged X5 and X3. These printers combine precision-built hardware, advanced sensors, and best-in-class software to deliver accurate parts, repeatedly. The company expects to launch additional traceable materials in the future.
Posted July 26, 2021
Source: Markforged