BIELLA, Italy — January 8, 2025 — From stylistic suggestions to actual production, from yarns to fabrics, in a “producer to producer” dialogue along the supply chain. This is the idea feeding the exclusive innovation which will be launched during Filo63: a Capsule Collection achieved by “translating” into fabric plots the contents of “Collages”– the Dialoghi Creativi of the 63rd edition of Filo suggested by Gianni Bologna (Responsible for Filo’s style and creativity).
February 2025 edition marks a crucial step: Filo starts its production: a range of fabric prototypes that will be exhibited within the Area of Dialoghi Creativi, in a space totally dedicated to product research and development and to its production and processing stages.
Specifically, Filo Capsule Collection proposes fabric prototypes designed by Rossano Bisio – Fabric Designer – being inspirated by “Collages” – the product development proposals carried out by Gianni Bologna for Filo63. The fabrics are produced by using exhibitors’ yarns, with special attention to materials. Rossano Bisio explains: “The aim is turning Filo’s product development proposals – that have been presented in a descriptive and multimedia way so far – into real fabrics included in a real collection, by using those techniques considered to be among the most representative ones of the great Italian manufacturing tradition.”
Paolo Monfermoso – Responsible for Filo – declares: “Nowadays, textile-apparel industry needs to highlight and to strengthen technical skills, which risk becoming weak and being underestimated. Through Filo Capsule Collection we want to help reverse the trend, and we do it by introducing something totally innovative within the international exhibition panorama: a project where our exhibition starts its production, offering textile professionals actual tools aiming at stimulating creativity and increasing innovation research in our industry. Embodying those characteristics which have always distinguished Filo, the project has been implemented thanks to the strong collaboration among all those participating in the exhibition, in their different roles, firs of all our exhibitors.”
The 63rd edition of Filo will be held on the 26th and the 27th of February 2025 at Allianz MiCo – viale Eginardo GATE 3 – Milan.
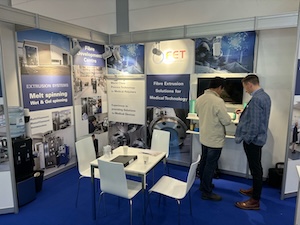
LEEDS, England — January 8, 2025 — England-based Fibre Extrusion Technology Ltd. (FET) enjoyed a highly successful exhibition at COMPAMED 2024 in Düsseldorf, Germany. This was the first time that FET had exhibited at this leading international trade fair for the medical technology supplier sector, a reflection of the company’s growing role in the global medical sector. In 2023-24, over 60 percent of FET’s turnover was derived from the medical market.
“It is never certain whether a new exhibition will prove to be a successful venture until it is tested in practice” commented FET’s Managing Director Richard Slack, “but we are delighted to report that COMPAMED 2024 exceeded all expectations. In fact, we have already booked a stand for next year’s exhibition in November, albeit in a slightly different location.”
COMPAMED 2024 attracts suppliers of a comprehensive range of high-quality medical technology components, services and production equipment for the medical industry. FET’s expertise in this sector therefore proved to be a perfect fit. With almost 40 serious customer leads taken at the show from both existing and previously unidentified clients, the initial outlook is for a very successful exhibition which will be followed up by future participation at this annual event.
FET’s established expertise lies in laboratory and pilot melt spinning equipment for a vast range of applications, especially precursor materials used in high value medical devices and specialised novel fibres from exotic and difficult to process polymers. In cases where melt spinning solutions are not suitable, FET provides a viable alternative with pilot and small scale production wet spinning systems.
Central to FET’s success has always been its ability to provide customers with advanced testing facilities and equipment at its Fibre Development Centre in Leeds, complemented by unrivalled knowledge and expertise in research and production techniques.
FET has successfully processed over 100 different polymer types and its systems can melt spin resorbable polymers in multifilament, monofilament and nonwoven formats, collaborating with specialist companies worldwide to promote greater sustainability through innovative manufacturing processes.
KANSAS CITY, Mo. — January 8, 2025 — Fueled by rapid growth in the global market and a brand evolution that focuses on sustainably-minded performance technologies, eVent®️ Fabrics, a global supplier of waterproof and breathable fabric technologies, is doubling down on their mission of bringing the best weather protection and introducing the new “defy the elements” tagline.
Intended to bridge the gap between eVent’s mission to craft advanced, high-performing materials that push the boundaries of what’s possible in outdoor gear and the users’ refusal to let the weather dictate their outdoor adventure plans, “defy the elements” encapsulates a new vision for the brand.
“Our products are born from a relentless pursuit of excellence, where every fiber, weave, and layer is designed to stand up to nature’s harshest conditions” said Chad Kelly, president of eVent Fabrics. “Our “defy the elements” tagline encapsulates our commitment to innovation and quality. It speaks to the core of what we do — empowering our users to face the elements head-on. Whether it’s torrential rain, biting wind, or extreme temperatures, our fabrics are engineered to keep you comfortable and dry, no matter the circumstances.”
Back country skiers walking up following their route in a windy winter day. The snow from the slopes is sprayed by the storm forming beautiful light effect.
The new tagline is intended to capture the imaginations of both new and existing brand customers, while providing end users with the knowledge and confidence that eVent understands their needs, providing a range of first-in-class laminates for a wide range of outdoor activities.
The new eVent tagline will be ubiquitous with the brand, appearing on hang tags, brand collateral, and in all brand communications.
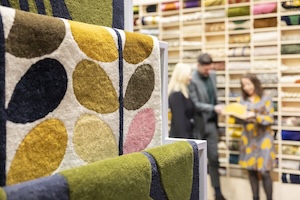
HANNOVER, Germany — January 8, 2025 — Hannover Milano Fairs Shanghai, the joint venture between Deutsche Messe and Fiera Milano in China, has joined forces with Globus Events to form a new company, DACF Exhibitions Shanghai Ltd. The partnership, announced during the 20th China Expo Forum for International Cooperation (CEFCO), solidifies both organizations’ commitment to expanding business opportunities in the Asia-Pacific region’s flooring industry and beyond.
Under the new agreement, DACF Exhibitions Shanghai Ltd. will assume full responsibility for organizing and managing DOMOTEX asia/CHINAFLOOR, the largest flooring exhibition in APAC. The landmark show — part of Deutsche Messe’s globally recognized DOMOTEX portfolio — has been held in Shanghai for 26 years and attracted more than 83,000 trade visitors from 117 countries in its most recent edition.
Strengthening Market Presence and Industry Innovation
“This joint venture marks a significant milestone in our longstanding collaboration with Globus Events,” said Sonia Wedell-Castellano, Global director at Deutsche Messe. “By combining our resources and expertise, we can elevate DOMOTEX asia/CHINAFLOOR to new heights and create unparalleled value for exhibitors and visitors.” Wedell-Castellano also emphasized the importance of innovation, stating, “The flooring industry is at the forefront of sustainable development and technological advancement, and we are proud to be part of its ongoing evolution.”
Expanding Opportunities across APAC
Edwin Chen, CEO of Globus Events, highlighted the importance of this new chapter: “Over the years, our partnership with Hannover Milano Fairs and Deutsche Messe has delivered the leading international tradeshow for the flooring industry in the region. The creation of DACF Exhibitions Shanghai Ltd. underscores our shared commitment to invest further in this vital platform and explore fresh opportunities across APAC.”
Next Edition Scheduled for May 2025
The 27th DOMOTEX asia/CHINAFLOOR is scheduled for May 26 to 28, 2025, at the National Exhibition and Convention Center (NECC – Hongqiao). Organizers expect around 1,600 exhibitors to present their latest products and innovations, spanning seven halls and covering 200,000 square meters of exhibition space. With the flooring sector navigating major transformations, DACF Exhibitions Shanghai Ltd. aims to deliver enhanced professional services, foster upstream and downstream synergies, and craft a more comprehensive platform that responds to evolving market needs.
Commitment to the Chinese Market
In an increasingly complex global environment, the formation of DACF Exhibitions Shanghai Ltd. underlines both Deutsche Messe and Globus Events’ dedication to expanding their presence and influence in China. The partnership will also explore new avenues for growth, leveraging each partner’s expertise in trade fair organization, event management, and venue operations.
For more information on DOMOTEX asia/CHINAFLOOR, visit www.domotexasiachinafloor.com
MÖNCHENGLADBACH, Germany — January 8, 2025 — Customer satisfaction is always Trützschler’s top priority. And we know it’s the top priority for customers too. Trützschler’s 19-year success story with cotton spinner Hascevher in Türkiye is a shining example of how we not only keep our customers happy, but also contribute to the satisfaction of Hascevher’s customers.
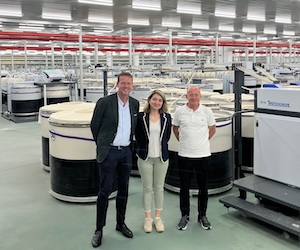
True innovators (from left to right): Gerhard Wienands (Regional Sales Manager atTrützschler), Buket Çelebi (General Manager Hascevher) and Christoph Weber (Managing Director Türkiye at Trützschler).
Hascevher Tekstil is a true innovator. It entered the textile market in 2006 and now employs more than 500 people across its sites in Türkiye, achieving annual sales of more than US$100 million. The dynamic company is characterized by its sharp focus on embracing trends and technologies that will shape the future. And it has worked side by side with Trützschler during its entire history to unlock business growth. “Our priority is to achieve continuous levels of productivity and quality throughout the life of our machines,” said Buket Çelebi, general manager at Hascevher. “This is only possible with great service support. That’s why we choose to work with our trusted partners at Trützschler.”
The story of Hascevher began at its factory in Kahramanmaraş. This site operates 8,616 rotor spindles with the capacity to produce 15,000 tons per year of 100-percent cotton yarn for knitwear and weaving in the range of Ne 6 to Ne 40. A major landmark for the company arrived in February 2024, when it invested 50 million euros to establish a new factory in the Bor district of Niğde, with support from Trützschler for the design, commissioning and delivery of this ambitious project. This second facility makes ring compact yarn in the range of Ne 20 to Ne 60 and has capacity to produce 15,000 tons per year. Across these two sites, more than 100 machines from Trützschler help to ensure outstanding quality that makes Hascevher’s customers satisfied.
Meeting diverse needs
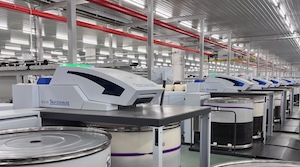
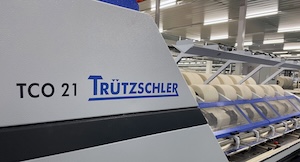
All TCO 21 combing machines at Hascevher’s facilities are equipped with fully-automated lap transport systems.
Those customers are mainly manufacturers of ready-made clothing, home textiles and technical textiles — with around 60 percent of Hascevher’s products exported to markets outside Türkiye. To meet the diverse needs of those final products and global markets, Hascevher relies on technologies and teams from Trützschler. It operates thirty-six TC 19i cards and thirty TCO 21 combers, for example. “The TC 19i achieves excellent quality at high production volumes and its design minimizes the risk of errors or defects because it offers a range of automated, self-optimizing functions,” Çelebi said. “With the TCO 21, we’re feeling the advantages of using a next-generation combing machine that stands out with its top quality, low maintenance requirements and easy adjustment.”
Building new factories
Hascevher uses next-generation TCO 21 combing machines from Trützschler because they offer top quality and low maintenance requirements.
In typical spirit, Hascevher is already making exciting plans to take its business to the next level. Another rotor yarn production facility is planned in the Niğde district. It will have capacity to manufacture 90 tons per day. And in the spirit of this long-standing partnership, they are already considering Trützschler machines for this new factory. “Of course, we want to include Trützschler technologies in our new facility,” Çelebi added. “They offer great support and innovative machines that enable high levels of quality and productivity. We also want to benefit from Trützschler’s after-sales service at this site just like we have benefitted from it throughout our relationship. It’s a pleasure for us to work with these experienced, solution-oriented and fast-responding teams.”
Making a decisive impact
Teams from Trützschler and Hascevher are in regular contact to discuss developments in the textile industry and explore potential ways of tapping into future opportunities. Sustainability is a key trend for both partners. They are engaged in close collaboration to find ways of using more sustainable raw materials and reducing greenhouse gas emissions, while also saving energy and water. “We sell to global markets in a business environment with intense competition,” Çelebi noted. “That is why we are always seeking innovations that can boost our efficiency or productivity, cut costs or make our products more sustainable. The machines we choose make a decisive impact on our progress in those areas. With Trützschler by our side, we’re confident about our exciting future — and confident about making our customers happy, too.”
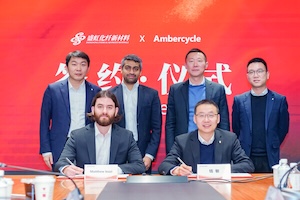
LOS ANGELES — January 7, 2025 — Ambercycle and Shenghong Holding Group have announced a strategic partnership to scale the production of regenerated filament yarns made with cycora® material. This collaboration brings cycora into the Chinese value chain, addressing global demand for truly circular solutions in the apparel industry.
Shenghong and Ambercycle team came together to commemorate partnership signing ceremony. (From left to right: Top row: Gerry Xue – Country Manager, China, Ambercycle; Shay Sethi – CEO, Ambercycle; Jason Tang – General Manager, Shenghong; Alex Miao – Marketing Director, Shenghong; Bottom row: Matthew Iezzi – Head of Production, Ambercycle; Charming Qian – Vice General Manager, Shenghong.)
Since 2024, Ambercycle and Shenghong have collaborated to develop high-quality regenerated filament yarns using cycora material. “As the industry adopts textile-to-textile solutions, cycora is leading the way in delivering materials that meet the demands of global brands,” said Jason Tang, general manager of Shenghong Chemical Fiber New Material. “This partnership is pivotal in driving scalable, impactful change across the apparel sector.”
Today, less than 1 percent of end-of-life textiles are recycled in closed-loop systems. By replacing virgin inputs with textile-to-textile regenerated materials, cycora enables brands to integrate sustainability into their supply chains seamlessly. This partnership accelerates the industry’s transition to a circular future, where waste is reimagined as a valuable resource.
Shay Sethi, co-founder and CEO at Ambercycle, said: “Our partnership with Shenghong underscores our shared vision for a circular future. By leveraging Shenghong’s advanced manufacturing capabilities, we can ensure cycora is seamlessly integrated into the supply chains of leading global brands. Together, we’re not just scaling production; we’re driving the adoption of circular materials across the apparel industry at the pace necessary to meet the growing demand.”
With Shenghong’s world-class yarn manufacturing capabilities and Ambercycle’s expertise in circular materials, this alliance is uniquely positioned to scale the production of textile-to-textile filament yarns for global adoption. Shenghong, one of the largest and most advanced recycled producer of polyester from bottles, is now advancing circularity in the apparel industry by introducing a textile-to-textile solution through cycora® material.
DALLAS — January 7, 2025 — RTCM Holdings Inc. (dba Reclaimed Cleaning Textiles, dba World Wear Project), a family of textile recycling and distribution companies, today announced the purchase of United-Southern Waste Material Company (USW), a Dallas-based textile recycling and repurposing company. The transaction will establish the largest textile recycler in North Texas.
Founded in 1914, USW specializes in the recycling and repurposing of clothing and wiping rags, which are sold across global and domestic markets, respectively. The company has built a reputation as a highly respected organization in the space, expanding in recent years to collect its own credential, with more than 120 bins. USW currently operates out of an 88,000 square foot facility. Co-owner and third-generation family member Mindi Levine Kahn will remain with the business to provide her expertise and ensure continuity throughout the integration.
“Our stated vision is to divert 100 million pounds of textiles from landfills on an annual basis as part of our commitment to make a difference in the world,” said Craig McAndrews, president and CEO of Reclaimed Cleaning Textiles. “USW’s operation will help us expand our capacity and drive essential long-term growth. Mindi and her family have been pioneers in the second-hand clothing industry, and we are excited to come together to create a best-in-class regional operation.”
“Reclaimed Cleaning Textiles has long been a leader in the recycled textiles space, with a focus on sustainable profitability,” said Mindi Levine Kahn. “This next chapter will offer customers, suppliers, and employees enhanced resources in an evolving market.”
Wyrick Robbins Yates & Ponton LLP served as legal counsel for Reclaimed Cleaning Textiles, and Haynes and Boone, LLP served as legal counsel for USW. Financial terms were not disclosed.
SEOUL — January 7, 2025 — As part of its commitment to continuous creative innovation and sustainable textile solutions across the entire value chain, Hyosung’s Fashion Design Center (FDC), which is an interactive fashion studio that spans the U.S., Europe, and Asia renowned for analyzing progressive brands and retailers while researching consumer insights, has unveiled its forecasted FW 26/27 Textile Trend report. This report, titled Restorative Journey, outlines the essential materials that leading apparel brands are expected to integrate into their collections in the coming year.
Restorative Journey embraces three major trends – Wellness Travel, Emergence of Quiet Outdoor, and Eco-Accountability.
Wellness Travel: Travel has evolved beyond traditional sightseeing. Today, many travelers are increasingly focused on improving their physical and mental well-being, often seeking this through their journeys. The wellness tourism market, fueled by growing interest in personal health, the expanding travel industry, and the rise of adventure sports, is set to keep growing, offering a wide range of experiences designed to meet the diverse needs of travelers.
The Emergence of Quiet Outdoor: Outdoor enthusiasts are shifting away from products with bold logos and intricate details, favoring simpler, more refined designs that exude understated luxury. This evolution is reshaping the Gorpcore trend, with a growing demand for elevated garments featuring minimal branding and technical fabrics that effortlessly transition between urban and outdoor settings. A new trend emphasizing minimalist, functional outdoor style is gaining momentum this season.
Eco-Accountability: Responses to the climate crisis have evolved from a sense of ‘urgency’ to recognizing it as an ’emergency,’ with accountability now becoming the critical next step. Both corporations and individuals must embrace accountability as a core principle to move beyond eco-rage and foster hope, as environmental extremes increasingly affect daily life. The fashion and apparel industry faces mounting pressure, with both suppliers and consumers needing to prioritize eco-responsibility to safeguard the planet.
According to Gary Oh, Team/General Manager, Hyosung FDC, the first step to prepare for the forthcoming sustainability regulations, fashion brands are turning to planet-friendly raw materials, especially bio-based raw materials that can reduce dependence on fossil fuels and achieve a low carbon footprint. These bio-derived materials are not limited to only fibers, but also in the production process including membranes and finishings.
With this insight in mind, FDC predicts the three following themes for apparel made with Hyosung’s broad range of CREORA® and certified sustainable regen™ brands of spandex, performance nylon and polyester yarns.
Activewear
Feel Good Dash: Running core-fashions with enhanced performance.
Refined Athluxe: Luxurious, durable activewear pieces with a sleek and sheen surface along with comfort stretch for the gym and street.
Paper-Weight Shield: Lightweight woven fabrics updated in papery touch and semi-shiny surface.
Outdoor Wear
Technical Luxury: Sophisticated travel wear to minimal outdoor wear on or off the mountain.
Off the Slope: Ski inspired winter resort sportswear that’s versatile to be worn off the slopes.
Toasty Fleece: Winter outdoor essentials with renewed fleece.
Loungewear
Saturday Stretching: Gentle exercise in bed for wellness.
Duvet Recovery: Soft brush lounge fabrics for better rest.
Relaxed Chic: Formal style, yet comfortable feel.
More detailed information on FDC’s FW 26/27 Textile Trends will be presented in a weekly Trend Byte series featured on the Hyosung Performance Textiles Creativity Inspired blog beginning January 6, 2025.
GAITHERSBURG, M.D. — January 7, 2025 — Picture this: You have a bag of heavily used clothes that can no longer be donated taking up space in your closet, so you drop it off at your local recycling center. But what happens to that bag of clothes? You might assume that the clothes would get broken down and reused to make new products.
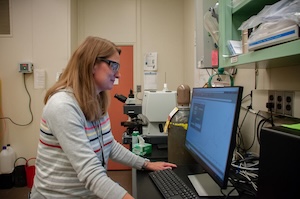
Researcher Amanda Forster stands in her lab looking at near-infrared spectroscopy data obtained from clothing and textile samples. Photo — A. Boss/NIST
However, according to the Environmental Protection Agency (EPA), in 2018 around 85 percent of used clothes and textiles headed to landfills and incinerators, wasting precious resources and polluting our environment. One reason is that recycling can be more expensive than landfilling, so companies have little incentive to recycle.
To help solve this problem, researchers at the National Institute of Standards and Technology (NIST) have developed a database that contains the molecular “fingerprints” of different kinds of textile fibers and that can enable more rapid, efficient sorting of fabrics at recycling centers.
“This reference data will help improve sorting algorithms and unlock the potential for high-throughput sorting, which requires less manual labor,” said Amanda Forster, a NIST materials research engineer. Forster leads the NIST project focused on keeping end-of-life textiles in the economy, a process called textile circularity. “That should reduce costs and increase efficiency, making textile recycling more economically viable.”
The database is free and available to download at the NIST Public Data Repository. https://data.nist.gov/od/id/mds2-3325
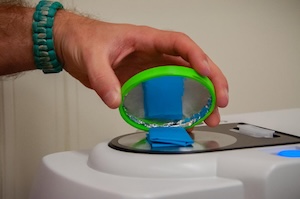
A clothing sample is analyzed using an analytical lab technique called near-infrared spectroscopy. The method measures how much of the light passes through or scatters off the fabric, producing a unique pattern — a sort of fingerprint that can identify the types of fibers in clothing. Photo — A. Boss/NIST
The problem of textile waste has been growing in recent years. One reason is fast fashion, a business model that has companies churning out large volumes of inexpensive, trendy clothes that are often quickly discarded. New types of textiles, blended textiles, and incomplete or inaccurate labeling also pose significant challenges when it comes to sorting textiles at recycling centers.
At those centers, workers sort clothing using handheld devices that shine near-infrared light. Those devices measure how much of the light passes through or scatters off the fabric, producing a unique pattern — a sort of fingerprint that can identify the type of fibers in the clothing. This technique, called near-infrared (NIR) spectroscopy, can also be used in automated conveyor belt systems. However, current techniques still require a lot of manual labor.
In recent years, recycling equipment manufacturers have increasingly used machine learning and artificial intelligence to improve their sorting algorithms. To train these algorithms, they need high-quality reference data.
That’s where NIST’s database comes in. Called the Near-Infrared Spectra of Origin-defined and Real-world Textiles, or NIR-SORT, it contains 64 different fabric types along with the NIR fingerprints they produce. The database includes pure fiber types, such as cotton and polyester; blended fiber types, such as spandex blends; and real-world fabrics taken from thrift stores. Manufacturers of NIR scanner systems can use this database to train and test their sorting algorithms and improve the performance of their products.
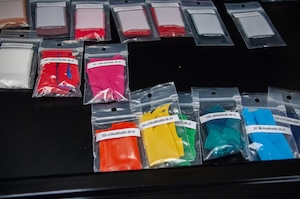
NIST researchers have developed a database that contains the molecular “fingerprints” of different kinds of fabrics. Some of the clothing and textile samples for the database are shown here. Photo — A. Boss/NIST
“The difficulty comes in when fibers are similar, like cotton or hemp. That means that the near-infrared signal is similar. The same is true with a cotton and polyester blend. Is this a new fiber or a blend of two or more fibers?” said NIST research chemist Katarina Goodge, who led the development of the database. “AI can help make the decision-making process more accurate.”
Because NIST is the nation’s measurement institute, it has the equipment and expertise to fill this database with very high-quality spectra. That will hopefully mean fewer errors when identifying fabrics, and more textiles getting recycled.
This research stems from a key initiative of a report by NIST in which experts recommended the development of better technology for identifying and sorting textiles and clothing. These efforts are part of NIST’s Circular Economy Program, which develops measurement science and methods to support an economy where materials are designed to retain their value through repeated reuse, repair and recycling, with disposal as a last resort.
Posted: January 7, 2025
Source: National Institute Of Standards And Technology — US Department Of Commerce
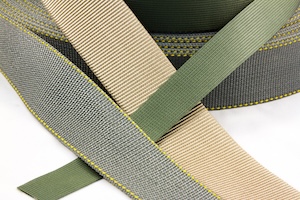
BALLY, Pa. — January 7, 2025 — Bally Ribbon Mills (BRM) — an industry designer, developer, and manufacturer of highly specialized engineered woven fabrics — announced it will showcase its high-quality, high-performance tapes and webbing at the SHOT Week Supplier Showcase, booth 51238, to be held January 20-21, 2025, as part of SHOT Show. Visit BRM at SHOT Show to meet with subject matter experts and see samples of industry-leading specialty binding tapes, 100 percent Berry-compliant polyester webbing, and harness, belt, and sling webbing.
In partnership with NASA, BRM developed the 3D Orthogonally woven 3DMAT Quartz Material for the Orion Multi-Purpose Crew Vehicle (MPCV) compression pads. The 3DMAT Quartz Material was named the 2023 NASA Government Invention of the Year.
Visitors to the booth can see samples of BRM’s specialty textile materials used to land NASA’s Perseverance and Curiosity rovers on Mars. Tapes and webbing for the current Artemus program that will be on display include those used in inflatable habitats, flight suits, and rocket deceleration, and safety systems. These are good examples of NASA partnering with American small business with a unique specialized technological capability that will further current and future exploration plans.
Showcased at the booth will be representative samples of BRM’s specialty binding tapes, ideal for improved abrasion resistance and toughness. BRM’s materials offer consistent quality and width, optimizing the sewing fabrication process. They also enable significantly better throughput, making them a better overall value than lower quality tapes. There are several finishes for improved “hand” available.
Also on display are samples of BRM’s 100 percent Berry Amendment-compliant polyester webbing, ideal for use by DOD contractors manufacturing aircraft seat belts, retractors, restraining harnesses, and tie-downs. BRM’s Berry-compliant webbing is a good choice for civilian agencies involved in U.S. military procurement activities. Webbing is available in a wide range of widths, from 1-inch to 6-inch and is offered in low minimum runs and custom dye colors.
The harness, belt, and sling webbing that will be showcased at the booth is available in small runs with customization of dye color, widths, and weave designs and patterns. BRM experts offer complete design and textile engineering services.
For more information, speak with BRM experts in booth 51238 at the SHOT Week Supplier Showcase, or visit https://www.ballyribbon.com/.
 February 2025 edition marks a crucial step: Filo starts its production: a range of fabric prototypes that will be exhibited within the Area of Dialoghi Creativi, in a space totally dedicated to product research and development and to its production and processing stages.