TEMPE, Ariz. — May 3, 2021 — Economic activity in the manufacturing sector grew in April, with the overall economy notching an 11th consecutive month of growth, say the nation’s supply executives in the latest Manufacturing ISM® Report On Business®.
The report was issued today by Timothy R. Fiore, CPSM, C.P.M., Chair of the Institute for Supply Management® (ISM®) Manufacturing Business Survey Committee:
“The April Manufacturing PMI® registered 60.7 percent, a decrease of 4 percentage points from the March reading of 64.7 percent. This figure indicates expansion in the overall economy for the 11th month in a row after contraction in April 2020. The New Orders Index registered 64.3 percent, declining 3.7 percentage points from the March reading of 68 percent. The Production Index registered 62.5 percent, a decrease of 5.6 percentage points compared to the March reading of 68.1 percent. The Backlog of Orders Index registered 68.2 percent, 0.7 percentage point higher compared to the March reading of 67.5 percent. The Employment Index registered 55.1 percent, 4.5 percentage points lower than the March reading of 59.6 percent. The Supplier Deliveries Index registered 75 percent, down 1.6 percentage points from the March figure of 76.6 percent. The Inventories Index registered 46.5 percent, 4.3 percentage points lower than the March reading of 50.8 percent. The Prices Index registered 89.6 percent, up 4 percentage points compared to the March reading of 85.6 percent. The New Export Orders Index registered 54.9 percent, an increase of 0.4 percentage point compared to the March reading of 54.5 percent. The Imports Index registered 52.2 percent, a 4.5-percentage point decrease from the March reading of 56.7 percent.”
Fiore continued: “The manufacturing economy continued expansion in April. Survey Committee Members reported that their companies and suppliers continue to struggle to meet increasing rates of demand due to coronavirus (COVID-19) impacts limiting availability of parts and materials. Recent record-long lead times, wide-scale shortages of critical basic materials, rising commodities prices and difficulties in transporting products are continuing to affect all segments of the manufacturing economy. Worker absenteeism, short-term shutdowns due to part shortages, and difficulties in filling open positions continue to be issues that limit manufacturing-growth potential. Optimistic panel sentiment increased, with 11 positive comments for every cautious comment, compared to an 8-to-1 ratio in March. Demand expanded, with the (1) New Orders Index growing at a strong level, supported by the New Export Orders Index continuing to expand, (2) Customers’ Inventories Index hitting another all-time low and (3) Backlog of Orders Index continuing at a record-high level. Consumption (measured by the Production and Employment indexes) indicated some cooling, posting a combined 10.1-percentage point decrease to the Manufacturing PMI® calculation. All top six industries reported moderate to strong consumption expansion. The Employment Index expanded for the fifth straight month, but panelists continue to note significant difficulties in attracting and retaining labor at their companies’ and suppliers’ facilities. Inputs — expressed as supplier deliveries, inventories, and imports — continued to support input-driven constraints to production expansion, at lower rates compared to March, due to an undesired inventory draw down. Inputs negatively contributed to the PMI® calculation, by a combined 5.9 percentage points. The importation of items marginally slowed in the period, driven by port backlogs. The Prices Index expanded for the 11th consecutive month, indicating continued supplier pricing power and scarcity of supply chain goods.
“All of the six biggest manufacturing industries — Fabricated Metal Products; Chemical Products; Food, Beverage & Tobacco Products; Computer & Electronic Products; Transportation Equipment; and Petroleum & Coal Products, in that order — registered moderate to strong growth in April.
“Manufacturing performed well for the 11th straight month, with demand, consumption and inputs registering strong growth compared to March. Labor-market difficulties at panelists’ companies and their suppliers persist. End-user lead times (for refilling customers’ inventories) are extending. This is due to very high demand and output restrictions, as supply chains continue to respond to strong demand amid COVID-19 impacts,” says Fiore.
All 18 manufacturing industries reported growth in April, in the following order: Electrical Equipment, Appliances & Components; Textile Mills; Furniture & Related Products; Machinery; Fabricated Metal Products; Primary Metals; Miscellaneous Manufacturing; Chemical Products; Plastics & Rubber Products; Food, Beverage & Tobacco Products; Computer & Electronic Products; Nonmetallic Mineral Products; Apparel, Leather & Allied Products; Transportation Equipment; Paper Products; Petroleum & Coal Products; Printing & Related Support Activities; and Wood Products.
What Respondents Are Saying
“The current electronics/semiconductor shortage is having tremendous impacts on lead times and pricing. Additionally, there appears to be a general inflation of prices across most, if not all, supply lines.” (Computer & Electronic Products)
“Upstream producers/suppliers are back online and working towards full rates. Demand is outpacing supply and will continue into the third quarter, when the supply chain is expected to be refilled. Supply/demand should be more balanced in Q3/Q4, but demand will continue as customers run hard to meet their demand and rebuild inventory.” (Chemical Products)
“Continued strong sales; however, we have had to trim some production due to the global chip shortage. Hasn’t affected inventories greatly yet, but a continued decrease will begin to reduce available inventories if we don’t recover chip supply shortly.” (Transportation Equipment)
“Business is picking up as restaurants open.” (Food, Beverage & Tobacco Products)
“Oil production has been steady, along with market prices and capital expenditures.” (Petroleum & Coal Products)
“Steel prices are crazy high. The normal checks on the domestic steel mills are not functioning — imported steel is distorted by the Section 232 tariffs.” (Fabricated Metal Products)
“It’s getting much more difficult to supply production with materials that are made with copper or steel. Lots of work on the floor, but I am worried about getting the materials to support.” (Electrical Equipment, Appliances & Components)
“Market capacity in most areas is oversold, with no realistic improvement on the horizon. In fact, it appears that demand will continue to strengthen, leading to more significant disruptions.” (Furniture & Related Products)
“In 35 years of purchasing, I’ve never seen everything like these extended lead times and rising prices — from colors, film, corrugate to resins, they’re all up. The only thing plentiful at present, according to my spam filter, is personal protective equipment [PPE].” (Plastics & Rubber Products)
“The metals markets remain very challenging at best. Shortages of raw materials have increased, especially in aluminum and carbon steel. Prices continue to rapidly increase. Transportation and trucking [are] also a big challenge.” (Primary Metals)
“Demand continues to be very strong. Supply chain delays hamper our availability and ability to sell more.” (Machinery)
| MANUFACTURING AT A GLANCE
April 2021 |
| Index |
Series
IndexApr |
Series
IndexMar |
Percentage
Point
Change |
Direction |
Rate of Change |
Trend* (Months) |
| Manufacturing PMI® |
60.7 |
64.7 |
-4.0 |
Growing |
Slower |
11 |
| New Orders |
64.3 |
68.0 |
-3.7 |
Growing |
Slower |
11 |
| Production |
62.5 |
68.1 |
-5.6 |
Growing |
Slower |
11 |
| Employment |
55.1 |
59.6 |
-4.5 |
Growing |
Slower |
5 |
| Supplier Deliveries |
75.0 |
76.6 |
-1.6 |
Slowing |
Slower |
62 |
| Inventories |
46.5 |
50.8 |
-4.3 |
Contracting |
From Growing |
1 |
| Customers’ Inventories |
28.4 |
29.9 |
-1.5 |
Too Low |
Faster |
55 |
| Prices |
89.6 |
85.6 |
+4.0 |
Increasing |
Faster |
11 |
| Backlog of Orders |
68.2 |
67.5 |
+0.7 |
Growing |
Faster |
10 |
| New Export Orders |
54.9 |
54.5 |
+0.4 |
Growing |
Faster |
10 |
| Imports |
52.2 |
56.7 |
-4.5 |
Growing |
Slower |
10 |
| OVERALL ECONOMY |
Growing |
Slower |
11 |
| Manufacturing Sector |
Growing |
Slower |
11 |
Manufacturing ISM® Report On Business® data is seasonally adjusted for the New Orders, Production, Employment and Inventories indexes.
*Number of months moving in current direction.
Commodities Reported Up/Down In Price And In Short Supply
Commodities Up in Price
Acetone (3); Acrylonitrile Butadiene Styrene (ABS) Plastic (4); Adhesives (2); Aluminum (11); Aluminum Extrusions (3); Aluminum Products; Caustic Soda; Coatings; Copper (11); Copper Products (2); Corrugate (7); Corrugated Boxes (6); Crude Oil (5); Diesel (4); Electrical Components (5); Electronic Components (5); Fasteners; Foam Products (2); Freight (6); High-Density Polyethylene (HDPE) (4); Liquid-Crystal Displays (LCD); Lubricants; Lumber (10); Maintenance, Repair and Operating (MRO) Materials; Natural Gas; Nylon Fiber (4); Ocean Freight (5); Packaging Supplies (5); Paper Products (5); Petroleum-Based Products (2); Plastic Film; Plastic Resins (8); Polycarbonates; Polyethylene (3); Polypropylene (10); Polyvinyl Chloride (PVC) Resins (7); Precious Metals; Printed Circuit Boards; Propylene Glycol; Resin-Based Products (3); Rubber Products (3); Semiconductors (3); Soybean Products (7); Steel (9); Steel — Carbon (5); Steel — Cold Rolled (8); Steel — Hot Rolled (8); Steel — Stainless (6); Steel Products (8); Styrene (2); Wood for Pallets; and Wood — Pallets (Finished Product) (5).
Commodities Down in Price
Propylene.
Commodities in Short Supply
Adhesives (2); Aluminum; Corrugated Boxes (6); Electrical Components (7); Electronic Components (5); Foam Products (2); Freight (2); Liquid-Crystal Displays (LCD); Light-Emitting Diode (LED) Displays (2); Lumber (2); Nylon Fiber; Ocean Freight; Personal Protective Equipment (PPE) — Gloves (14); Plastic Products (3); Plastic Resins — Other (2); Polypropylene; Rubber-Based Products; Semiconductors (5); Steel (5); Steel — Hot Rolled (6); Steel — Stainless (2); Steel Drums; Steel Products (3); and Wood — Pallets.
Note: The number of consecutive months the commodity is listed is indicated after each item.
April 2021 Manufacturing Index Summaries
Manufacturing PMI®
Manufacturing grew in April, as the Manufacturing PMI registered 60.7 percent, 4 percentage points lower than the March reading of 64.7 percent. Although the Manufacturing PMI® has cooled compared to March, it remains at historically high levels. “The Manufacturing PMI® continued to indicate strong sector expansion and U.S. economic growth in April. Four of the five subindexes that directly factor into the Manufacturing PMI® were in growth territory. All of the six biggest manufacturing industries expanded, in the following order: Fabricated Metal Products; Chemical Products; Food, Beverage & Tobacco Products; Computer & Electronic Products; Transportation Equipment; and Petroleum & Coal Products. The New Orders and Production indexes continued to expand at strong levels. The Supplier Deliveries Index continued to reflect suppliers’ difficulties in maintaining delivery rates, due to factory labor-safety issues, transportation challenges and increased demand. Nine of 10 subindexes were positive for the period; a reading of ‘too low’ for Customers’ Inventories Index is considered a positive for future production,” says Fiore. A reading above 50 percent indicates that the manufacturing economy is generally expanding; below 50 percent indicates that it is generally contracting.
A Manufacturing PMI above 43.1 percent, over a period of time, generally indicates an expansion of the overall economy. Therefore, the April Manufacturing PMI® indicates the overall economy grew in April for the 11th consecutive month following contraction in April 2020. “The past relationship between the Manufacturing PMI® and the overall economy indicates that the Manufacturing PMI® for April (60.7 percent) corresponds to a 5-percent increase in real gross domestic product (GDP) on an annualized basis,” says Fiore.
The Last 12 Months
| Month |
Manufacturing
PMI® |
|
Month |
Manufacturing
PMI® |
| Apr 2021 |
60.7 |
|
Oct 2020 |
58.8 |
| Mar 2021 |
64.7 |
|
Sep 2020 |
55.7 |
| Feb 2021 |
60.8 |
|
Aug 2020 |
55.6 |
| Jan 2021 |
58.7 |
|
Jul 2020 |
53.7 |
| Dec 2020 |
60.5 |
|
Jun 2020 |
52.2 |
| Nov 2020 |
57.7 |
|
May 2020 |
43.1 |
| Average for 12 months – 56.9
High – 64.7
Low – 43.1 |
New Orders
ISM®’s New Orders Index registered 64.3 percent in April, down 3.7 percentage points compared to the 68 percent reported in March. This indicates that new orders grew for the 11th consecutive month. “All of the six largest manufacturing sectors — Fabricated Metal Products; Chemical Products; Food, Beverage & Tobacco Products; Transportation Equipment; Computer & Electronic Products; and Petroleum & Coal Products — expanded at strong levels,” says Fiore. A New Orders Index above 52.8 percent, over time, is generally consistent with an increase in the Census Bureau’s series on manufacturing orders (in constant 2000 dollars).
Of the 18 manufacturing industries, the 16 that reported growth in new orders in April — in the following order — are: Electrical Equipment, Appliances & Components; Textile Mills; Fabricated Metal Products; Primary Metals; Paper Products; Machinery; Nonmetallic Mineral Products; Chemical Products; Furniture & Related Products; Miscellaneous Manufacturing; Food, Beverage & Tobacco Products; Transportation Equipment; Wood Products; Plastics & Rubber Products; Computer & Electronic Products; and Petroleum & Coal Products. The only industry reporting a decline in new orders in April is Printing & Related Support Activities.
| New Orders |
%Higher |
%Same |
%Lower |
Net |
Index |
| Apr 2021 |
48.7 |
43.4 |
7.9 |
+40.8 |
64.3 |
| Mar 2021 |
45.3 |
49.2 |
5.5 |
+39.8 |
68.0 |
| Feb 2021 |
42.4 |
51.2 |
6.4 |
+36.0 |
64.8 |
| Jan 2021 |
37.0 |
51.0 |
12.0 |
+25.0 |
61.1 |
Production
The Production Index registered 62.5 percent in April, 5.6 percentage points lower than the March reading of 68.1 percent, indicating growth for the 11th consecutive month. “Five (Petroleum & Coal Products; Fabricated Metal Products; Food, Beverage & Tobacco Products; Chemical Products; and Computer & Electronic Products) of the top six industries expanded at strong levels,” says Fiore. An index above 52.1 percent, over time, is generally consistent with an increase in the Federal Reserve Board’s Industrial Production figures.
The 14 industries reporting growth in production during the month of April — listed in order — are: Electrical Equipment, Appliances & Components; Primary Metals; Machinery; Petroleum & Coal Products; Miscellaneous Manufacturing; Fabricated Metal Products; Furniture & Related Products; Plastics & Rubber Products; Food, Beverage & Tobacco Products; Chemical Products; Wood Products; Computer & Electronic Products; Textile Mills; and Nonmetallic Mineral Products. The two industries reporting decreased production in April are: Printing & Related Support Activities; and Paper Products.
| Production |
%Higher |
%Same |
%Lower |
Net |
Index |
| Apr 2021 |
44.3 |
44.3 |
11.4 |
+32.9 |
62.5 |
| Mar 2021 |
43.0 |
48.9 |
8.1 |
+34.9 |
68.1 |
| Feb 2021 |
36.8 |
51.7 |
11.6 |
+25.2 |
63.2 |
| Jan 2021 |
30.8 |
57.8 |
11.4 |
+19.4 |
60.7 |
Employment
ISM’s Employment Index registered 55.1 percent in April, 4.5 percentage points lower than the March reading of 59.6 percent. “The Employment Index grew for the fifth month in a row. Of the six big manufacturing sectors, four (Fabricated Metal Products; Food, Beverage & Tobacco Products; Transportation Equipment; and Computer & Electronic Products) expanded. Continued strong new-order levels, low customer inventories and expanding backlogs indicate potential employment strength for the balance of the quarter. For the eighth straight month, survey panelists’ comments indicate that significantly more companies are hiring or attempting to hire than those looking to reduce head counts,” says Fiore. An Employment Index above 50.6 percent, over time, is generally consistent with an increase in the Bureau of Labor Statistics (BLS) data on manufacturing employment.
Of the 18 manufacturing industries, the 13 industries reporting employment growth in April — in the following order — are: Printing & Related Support Activities; Furniture & Related Products; Electrical Equipment, Appliances & Components; Fabricated Metal Products; Textile Mills; Food, Beverage & Tobacco Products; Plastics & Rubber Products; Nonmetallic Mineral Products; Machinery; Primary Metals; Transportation Equipment; Miscellaneous Manufacturing; and Computer & Electronic Products. The two industries reporting a decrease in employment in April are: Wood Products; and Paper Products.
| Employment |
%Higher |
%Same |
%Lower |
Net |
Index |
| Apr 2021 |
21.2 |
67.9 |
10.9 |
+10.3 |
55.1 |
| Mar 2021 |
23.9 |
69.0 |
7.2 |
+16.7 |
59.6 |
| Feb 2021 |
19.2 |
68.5 |
12.3 |
+6.9 |
54.4 |
| Jan 2021 |
13.9 |
72.2 |
13.8 |
+0.1 |
52.6 |
Supplier Deliveries†
The delivery performance of suppliers to manufacturing organizations was slower in April, as the Supplier Deliveries Index registered 75 percent. This is 1.6 percentage points lower than the 76.6 percent reported in March. Five (Computer & Electronic Products; Fabricated Metal Products; Chemical Products; Transportation Equipment; and Food, Beverage & Tobacco Products) of the six top manufacturing industries reported slowing deliveries. “Suppliers continue to struggle to deliver, with deliveries slowing at a marginally slower rate compared to the previous month. The Supplier Deliveries Index reflects difficulties suppliers continue to experience due to COVID-19 impacts as (1) hiring challenges, (2) raw materials lead times and pricing, (3) transportation availability and (4) raw materials inventories impact all levels of the supply chain. Supplier labor, material and transportation constraints are not expected to diminish in the second quarter due to continuing pandemic impacts amid strong demand,” says Fiore. A reading below 50 percent indicates faster deliveries, while a reading above 50 percent indicates slower deliveries.
Of the 18 industries, 17 reported slower supplier deliveries in April, listed in the following order: Apparel, Leather & Allied Products; Textile Mills; Paper Products; Machinery; Computer & Electronic Products; Fabricated Metal Products; Furniture & Related Products; Plastics & Rubber Products; Electrical Equipment, Appliances & Components; Miscellaneous Manufacturing; Chemical Products; Printing & Related Support Activities; Nonmetallic Mineral Products; Primary Metals; Transportation Equipment; Food, Beverage & Tobacco Products; and Wood Products. The only industry reporting faster supplier deliveries in April was Petroleum & Coal Products.
| Supplier Deliveries |
%Slower |
%Same |
%Faster |
Net |
Index |
| Apr 2021 |
53.9 |
42.2 |
3.9 |
+50.0 |
75.0 |
| Mar 2021 |
54.9 |
43.5 |
1.6 |
+53.3 |
76.6 |
| Feb 2021 |
45.4 |
53.1 |
1.5 |
+43.9 |
72.0 |
| Jan 2021 |
39.9 |
56.5 |
3.5 |
+36.4 |
68.2 |
Inventories
The Inventories Index registered 46.5 percent in April, 4.3 percentage points lower than the 50.8 percent reported for March. The Inventories Index moved back into contractionary territory after expanding for one month. “Inventories remain unstable due to ongoing supplier constraints. In April, supplier delivery rates were not able to keep up with new-order and production levels, causing a measurable draw down in raw material inventories at panelists’ companies,” says Fiore. An Inventories Index greater than 44.5 percent, over time, is generally consistent with expansion in the Bureau of Economic Analysis (BEA) figures on overall manufacturing inventories (in chained 2000 dollars).
The five industries reporting higher inventories in April are: Printing & Related Support Activities; Furniture & Related Products; Textile Mills; Machinery; and Fabricated Metal Products. The nine industries reporting a decrease in inventories in April — listed in order — are: Paper Products; Wood Products; Plastics & Rubber Products; Primary Metals; Nonmetallic Mineral Products; Computer & Electronic Products; Miscellaneous Manufacturing; Food, Beverage & Tobacco Products; and Transportation Equipment.
| Inventories |
%Higher |
%Same |
%Lower |
Net |
Index |
| Apr 2021 |
18.2 |
58.3 |
23.5 |
-5.3 |
46.5 |
| Mar 2021 |
22.4 |
58.4 |
19.2 |
+3.2 |
50.8 |
| Feb 2021 |
19.8 |
63.1 |
17.1 |
+2.7 |
49.7 |
| Jan 2021 |
18.1 |
65.6 |
16.3 |
+1.8 |
50.8 |
Customers’ Inventories†
ISM’s Customers’ Inventories Index registered 28.4 percent in April, 1.5 percentage points lower than the 29.9 percent reported for March, indicating that customers’ inventory levels were considered too low. “Customers’ inventories are too low for the 55th consecutive month, a positive for future production growth. For the second consecutive month, this subindex has registered its lowest reading since the subindex was established in January 1997. For nine straight months, the Customers’ Inventories Index has been at historically low levels,” says Fiore.
None of the 18 industries reported higher customers’ inventories in April. The 15 industries reporting customers’ inventories as too low during April — listed in order — are: Wood Products; Textile Mills; Nonmetallic Mineral Products; Primary Metals; Fabricated Metal Products; Machinery; Paper Products; Chemical Products; Computer & Electronic Products; Transportation Equipment; Miscellaneous Manufacturing; Electrical Equipment, Appliances & Components; Food, Beverage & Tobacco Products; Furniture & Related Products; and Plastics & Rubber Products.
| Customers’
Inventories |
%
Reporting |
%Too
High |
%About
Right |
%Too
Low |
Net |
Index |
| Apr 2021 |
80 |
3.7 |
49.4 |
46.9 |
-43.2 |
28.4 |
| Mar 2021 |
79 |
5.3 |
49.2 |
45.5 |
-40.2 |
29.9 |
| Feb 2021 |
79 |
4.8 |
55.4 |
39.8 |
-35.0 |
32.5 |
| Jan 2021 |
75 |
3.3 |
59.6 |
37.1 |
-33.8 |
33.1 |
Prices†
The ISM® Prices Index registered 89.6 percent, an increase of 4 percentage points compared to the March reading of 85.6 percent, indicating raw materials prices increased for the 11th consecutive month. In the last three months, the index has been at its highest levels since July 2008, when it registered 90.4 percent, the last of five straight months over 80 percent. “Aluminum, copper, chemicals, all varieties of steel, plastics, transportation costs, wood and lumber products all continued to experience price increases as a result of product scarcity,” says Fiore. A Prices Index above 52.7 percent, over time, is generally consistent with an increase in the Bureau of Labor Statistics (BLS) Producer Price Index for Intermediate Materials.
In April, for the fourth month in a row, all 18 industries reported paying increased prices for raw materials, in the following order: Apparel, Leather & Allied Products; Furniture & Related Products; Textile Mills; Printing & Related Support Activities; Primary Metals; Nonmetallic Mineral Products; Wood Products; Fabricated Metal Products; Plastics & Rubber Products; Machinery; Electrical Equipment, Appliances & Components; Computer & Electronic Products; Food, Beverage & Tobacco Products; Petroleum & Coal Products; Miscellaneous Manufacturing; Transportation Equipment; Chemical Products; and Paper Products.
| Prices |
%Higher |
%Same |
%Lower |
Net |
Index |
| Apr 2021 |
80.1 |
19.1 |
0.9 |
+79.2 |
89.6 |
| Mar 2021 |
71.6 |
27.9 |
0.5 |
+71.1 |
85.6 |
| Feb 2021 |
73.1 |
25.7 |
1.2 |
+71.9 |
86.0 |
| Jan 2021 |
64.3 |
35.7 |
0.0 |
+64.3 |
82.1 |
Backlog of Orders†
ISM’s Backlog of Orders Index registered 68.2 percent in April, a 0.7-percentage point increase compared to the 67.5 percent reported in March, indicating order backlogs expanded for the 10th straight month. April’s reading is the highest since reporting for this subindex began in January 1993. “Backlogs expanded at faster rates in April, indicating 10 months of new-order intakes more than fully offsetting production outputs. Five (Fabricated Metal Products; Computer & Electronic Products; Transportation Equipment; Chemical Products; and Food, Beverage & Tobacco Products) of the six big industry sectors reported that backlogs expanded strongly,” says Fiore.
The 14 industries reporting growth in order backlogs in April, in the following order, are: Textile Mills; Fabricated Metal Products; Machinery; Plastics & Rubber Products; Paper Products; Electrical Equipment, Appliances & Components; Nonmetallic Mineral Products; Computer & Electronic Products; Transportation Equipment; Primary Metals; Furniture & Related Products; Chemical Products; Miscellaneous Manufacturing; and Food, Beverage & Tobacco Products. No industries reported a decline in April compared to March.
| Backlog of
Orders |
%
Reporting |
%Higher |
%Same |
%Lower |
Net |
Index |
| Apr 2021 |
89 |
44.4 |
47.6 |
8.0 |
+36.4 |
68.2 |
| Mar 2021 |
91 |
43.1 |
48.8 |
8.1 |
+35.0 |
67.5 |
| Feb 2021 |
91 |
38.5 |
51.0 |
10.5 |
+28.0 |
64.0 |
| Jan 2021 |
91 |
32.1 |
55.2 |
12.7 |
+19.4 |
59.7 |
New Export Orders†
ISM®’s New Export Orders Index registered 54.9 percent in April, up 0.4 percentage point compared to the March reading of 54.5 percent. “The New Export Orders Index grew for the 10th consecutive month, and at a faster rate. Of the six big industry sectors, four (Chemical Products; Fabricated Metal Products; Food, Beverage & Tobacco Products; and Computer & Electronic Products) expanded. New export orders were again a positive factor to the growth in the New Orders Index,” says Fiore.
The seven industries reporting growth in new export orders in April — in the following order — are: Electrical Equipment, Appliances & Components; Chemical Products; Fabricated Metal Products; Food, Beverage & Tobacco Products; Miscellaneous Manufacturing; Machinery; and Computer & Electronic Products. The four industries reporting a decrease in new export orders are: Primary Metals; Paper Products; Plastics & Rubber Products; and Transportation Equipment. Six industries reported no change in exports in April as compared to March.
| New Export
Orders |
%
Reporting |
%Higher |
%Same |
%Lower |
Net |
Index |
| Apr 2021 |
72 |
16.3 |
77.1 |
6.5 |
+9.8 |
54.9 |
| Mar 2021 |
76 |
16.7 |
75.6 |
7.7 |
+9.0 |
54.5 |
| Feb 2021 |
73 |
20.5 |
73.4 |
6.1 |
+14.4 |
57.2 |
| Jan 2021 |
75 |
17.6 |
74.6 |
7.7 |
+9.9 |
54.9 |
Imports†
ISM®’s Imports Index registered 52.2 percent in April, a decrease of 4.5 percentage points compared to the 56.7 percent reported for March. “Imports expanded for the 10th consecutive month, at a slower rate compared to March, reflecting continuing increases in U.S. factory demand. Panelists continued to note backlogs in ports of entry, as well as difficulties in arranging drayage and operating within the domestic transportation market,” says Fiore.
The seven industries reporting growth in imports in April — in the following order — are: Chemical Products; Machinery; Nonmetallic Mineral Products; Electrical Equipment, Appliances & Components; Fabricated Metal Products; Food, Beverage & Tobacco Products; and Furniture & Related Products. The five industries reporting a decrease in imports in April are: Paper Products; Wood Products; Primary Metals; Computer & Electronic Products; and Miscellaneous Manufacturing. Six industries reported no change in imports in April compared to March.
| Imports |
%
Reporting |
%Higher |
%Same |
%Lower |
Net |
Index |
| Apr 2021 |
84 |
16.3 |
71.9 |
11.8 |
+4.5 |
52.2 |
| Mar 2021 |
87 |
19.9 |
73.6 |
6.5 |
+13.4 |
56.7 |
| Feb 2021 |
85 |
21.0 |
70.3 |
8.7 |
+12.3 |
56.1 |
| Jan 2021 |
84 |
21.9 |
69.9 |
8.3 |
+13.6 |
56.8 |
†The Supplier Deliveries, Customers’ Inventories, Prices, Backlog of Orders, New Export Orders, and Imports indexes do not meet the accepted criteria for seasonal adjustments.
Buying Policy
Average commitment lead time for Capital Expenditures increased in April by two days to 147 days. Average lead time for production materials increased in April by four days to 79 days — the highest figure since ISM® began collecting this data in 1987. Average lead time for Maintenance, Repair and Operating (MRO) Supplies increased in April by five days to 45 days.
| Percent Reporting |
| Capital
Expenditures |
Hand-to-
Mouth |
30 Days |
60 Days |
90 Days |
6 Months |
1 Year+ |
Average
Days |
| Apr 2021 |
21 |
5 |
7 |
16 |
32 |
19 |
147 |
| Mar 2021 |
23 |
4 |
9 |
17 |
26 |
21 |
145 |
| Feb 2021 |
23 |
6 |
8 |
15 |
29 |
19 |
142 |
| Jan 2021 |
21 |
6 |
10 |
15 |
30 |
18 |
141 |
| Percent Reporting |
| Production
Materials |
Hand-to-
Mouth |
30 Days |
60 Days |
90 Days |
6 Months |
1 Year+ |
Average
Days |
|
|
| Apr 2021 |
10 |
25 |
25 |
26 |
10 |
4 |
79 |
|
|
| Mar 2021 |
11 |
27 |
27 |
20 |
12 |
3 |
75 |
|
|
| Feb 2021 |
11 |
31 |
27 |
20 |
9 |
2 |
67 |
|
|
| Jan 2021 |
9 |
35 |
26 |
20 |
7 |
3 |
68 |
|
|
| Percent Reporting |
| MRO Supplies |
Hand-to-
Mouth |
30 Days |
60 Days |
90 Days |
6 Months |
1 Year+ |
Average
Days |
| Apr 2021 |
29 |
37 |
16 |
13 |
4 |
1 |
45 |
| Mar 2021 |
31 |
36 |
19 |
10 |
4 |
0 |
40 |
| Feb 2021 |
33 |
37 |
16 |
11 |
3 |
0 |
38 |
| Jan 2021 |
31 |
36 |
19 |
11 |
3 |
0 |
39 |
|
|
|
|
|
|
|
|
|
|
|
|
|
|
|
Posted May 3, 2021
Source: Institute for Supply Management

 GLENDALE, Calif. —May 4, 2021 — Avery Dennison today announced its ambition to be net-zero on greenhouse gas emissions by 2050. This commitment comes as the company raises the bar on its sustainability goals with new targets for 2030.
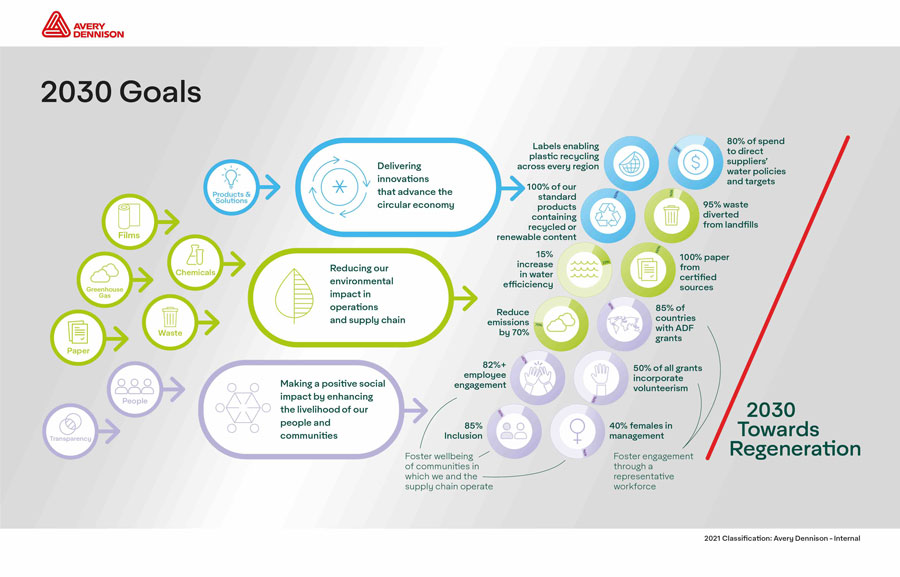 The company has also pledged to reduce emissions by 70 percent against its 2015 baseline, and to work with its supply chain to reduce Scope 3 emissions by 30 percent against its 2018 baseline. The company’s overall ambition is to produce net-zero emissions by 2050 and enable a future of regeneration. The 2030 goals also include targets for gender diversity, employee engagement and inclusion, safety, and more.