![]() TOKYO — July 21, 2026 — Teijin Limited announced today that it has developed a thermosetting, long carbon fiber-reinforced plastic (CFRP) that combines a heat-activated self-healing function with high recyclability, while offering mechanical properties equivalent to those of conventional CFRPs.
TOKYO — July 21, 2026 — Teijin Limited announced today that it has developed a thermosetting, long carbon fiber-reinforced plastic (CFRP) that combines a heat-activated self-healing function with high recyclability, while offering mechanical properties equivalent to those of conventional CFRPs.
Damaged areas of the new material can be repaired by being heated for a short time at a specified temperature, enabling repair rather than replacement and thereby helping to extend product lifetime and reduce resource consumption.
Further, Teijin’s CFRP enables recycling through a simple chemical decomposition process, thereby contributing to circularity. A wide range of applications can benefit from the strength and light weight of this CFRP material, including aircraft, automobiles and sporting goods.
There is growing demand for products that help to reduce greenhouse gas (GHG) emissions throughout the entire life cycle. However, CFRPs, made by impregnating carbon fiber with thermosetting resin, cannot be melted or remolded. Also, much of the waste generated after use is incinerated or landfilled, making it a priority to develop new CFRPs that can reduce environmental impact.
To date, Teijin has worked to reduce GHG emissions and cut waste through initiatives such as the development of Tenax Next, its carbon fiber brand based on circular feedstocks. Now, Teijin has leveraged its renowned polymer material design technologies, cultivated over many years, to develop new resin that retains the excellent mechanical properties of conventional materials while enabling recycling through resin decomposition and featuring a heat-activated self-healing function. The company incorporated this resin into its new a circular thermosetting CFRP, which helps reduce environmental impact while providing the strength and rigidity of conventional CFRPs.
Technology Functionality
Self-healing through heating
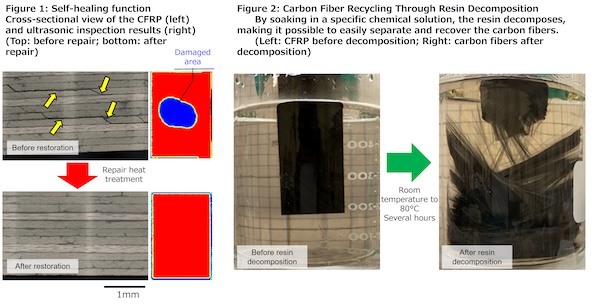
If the resin layer of the CFRP becomes damaged, it can easily be repaired by heating it at a prescribed temperature for a short time (Fig. 1). Thanks to this capability, CFRP material that has deteriorated can continue to be used, avoiding premature disposal and waste generation.
Recyclability through remolding
Once molded, conventional CFRP materials cannot be remolded because the impregnated thermoset resin does not melt or flow, even when heated. In contrast, Teijin’s new CFRP product exhibits flowability after molding when exposed to heat within a specified temperature range, making it possible to recycle the material through compression molding and other methods.
Carbon fiber retrieval/reuse through resin decomposition
Conventionally, separating carbon fiber from recovered thermosetting CFRP requires thermally decomposing the resin by combustion in a high-temperature furnace exceeding 400°C over a long period. This energy-intensive method imposes a significant environmental burden. Teijin’s newly developed CFRP can be decomposed by soaking it in a specific chemical solution, making it possible to easily separate the long carbon fibers from the thermoset resin. This simpler, shorter method enables the carbon fiber to be reclaimed with low environmental impact and excellent efficiency (Fig. 2).
 Note: These results were obtained, in part, through the Strategic Innovation Promotion Program (SIP) “Building a Circular Economy System” of the Council for Science, Technology and Innovation (CSTI), Cabinet Office (implementing agency: Environmental Restoration and Conservation Agency, Independent Administrative Institution) (JPJ012290).
Teijin aims to begin providing samples of this developmental CFRP product in the course of 2028, and will continue to advance research and development in collaboration with universities and research institutions. The company will seek to expand the use of this CFRP in a wide range of applications, focusing primarily on aircraft, automobiles, industrial machinery and other use cases where there is strong demand for weight reduction, improved durability and reduced environmental impact.
Furthermore, with an eye toward future mass production and social implementation of the new CFRP product, Teijin will promote development that optimizes every aspect, from material formulation and component design to recycling processes, while advancing application development and building a supply chain in collaboration with partner companies. In practical terms, Teijin Carbon is seeking opportunities for joint development projects.
Teijin will continue to strive to minimize the negative environmental and social impacts associated with its business activities and in parallel increase the performance of our solutions in the applications of our customers. This reinforces Teijin’s long-term vision to support the society of the future.
Posted: July 26, 2026
Source: Teijin Group / Teijin Carbon, a subsidiary of the Teijin Group