 TOKYO — January 6, 2022 — Teijin Ltd. announced today that it has launched an interactive bilingual (English/Japanese) website, named FUTURE NAVIGATION (https://futurenavigation-teijin.com), to interact with individuals and groups interested in discovering, discussing and co-creating solutions that address key issues in the modern world. More than just a platform for introducing Teijin’s technology and know-how, the website showcases unique and innovative initiatives, both internal and external, for solve pressing issues while also enabling visitors to interact with the company and each other to deepen communication targeting discovery and co-creation.
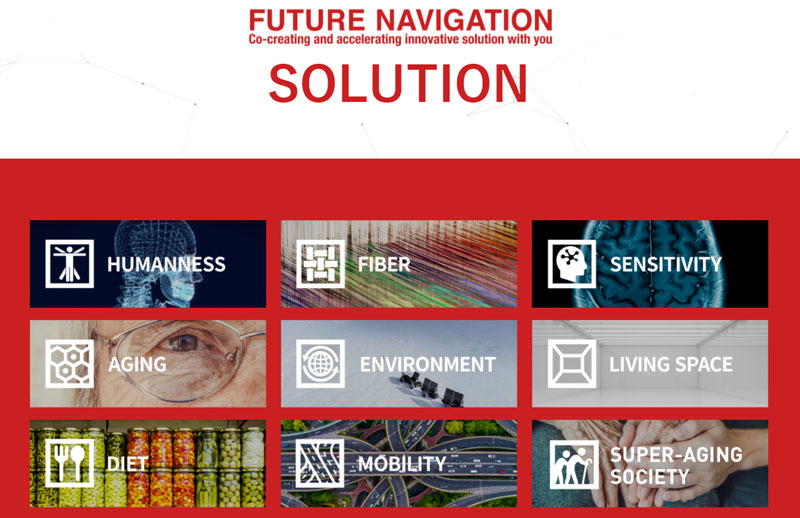
On the occasion of the company’s 100th anniversary in 2018, Teijin unveiled its Future Navigation global message regarding the company’s long-term vision, aiming to be an enterprise that supports the society of the future. The company also launched its Think Human Project targeting nine key areas, including the environment, mobility and aging, to put the Future Navigation message into practice.
The Future Navigation website will introduce diverse initiatives and related video interviews and essays on the Think Human Project. It will also introduce the company’s vision and market trends through dialogues between Teijin executive officers and external experts, as well as through interviews of end-user companies that utilize Teijin materials.
To nurture communication with and between visitors, the website is equipped with a tool that analyzes the interests of each viewer in real time and then generates topics with high affinity. Also, the website has pages for in-depth communication between visitors and Teijin, visitors and other visitors, and visitors and companies that showcase their projects on the website. Visitors also can access detailed information regarding Teijin businesses via links to various Teijin group companies.
Going forward, additional content will be added to the site and diverse solutions will be proposed for co-creation by combining materials from Teijin and other companies.
As background, Teijin’s Materials Business conducts web exhibitions in connection with ongoing initiatives aimed at achieving digital transformation (DX). The Teijin Materials Business Virtual Exhibition introduces solutions using high-performance materials and composite technologies that are contributing to increased sustainability. Also, Teijin Mobility Online introduces the company’s mobility-related solutions and new technologies. Based on internal and external comments regarding these initiatives, however, Teijin identified the need for a platform to help the company more accurately grasp latent needs in current society. The result was the decision to establish the new Future Navigation website.
As a human-centric company, Teijin pursues ceaseless evolution with the aim of becoming a company that supports the society of the future.
Posted January 11, 2022
Source: Teijin Ltd.