Making The Most Of Tax Breaks In The Year 2000

The Year 2000 (Y2K) problem is emerging as one of the most expensive accidents in history. Its cost
will certainly exceed that of the Kobe as well as the Los Angeles earthquakes plus Hurricane Andrew
(only $170 billion).With only a matter of months left before the problem hits the world head-on,
most textile, apparel and fiber business owners continue to put off their Y2K projects. Where
We StandAccording to a recent survey by the National Federation of Independent Business (NFIB) and
Wells Fargo Bank, of 500 small businesses, only 41 percent had addressed or intended to address the
Y2K problem, and 18 percent of the companies said that they were not at all or barely aware of the
problem.The survey estimates that 82 percent of all small business owners are at risk because they
use computers; use time/date systems that might be affected; or sell, lease or install equipment
that could be impaired.Most small businesses think they know about Y2K, but they dont understand
the whole picture, said William Dennis, senior research fellow at NFIB. They dont know some of the
more technical aspects of the problem.According to Dennis, the end-of-the-world scenarios in the
general press arent helping to legitimize the problem. Small business owners see stories about
possible bank failures and airplanes falling out of the sky when what they need is more discussion
about specific consequences, he said.Those textile operations that are ready to tackle Y2K still
face two major dilemmas. The first is, obviously, that there is not a great deal of time left in
which to deal with the problem. Secondly, the fix can be expensive even for an apparel or fibers
business that is not particularly computer-dependent. All of which make the tax breaks available
more important than usual.

Computer-Fix Tax BreaksUnder our tax rules, the cost related to the development of software
for the textile operations own use or for sale or lease to others may be immediately deducted.Or,
if it is more advantageous, the operation may amortize the costs over a five-year period or an even
shorter period is appropriate. All our lawmakers require is that all computer software costs be
treated consistently.One caveat, however, is that today a textile or fibers operation that
acquires, rather than develops software, can depreciate it over 36 months if it meets all of the
following requirements:It is readily available for purchase by the general public;It is not subject
to an exclusive license; andIt has not been substantially modified.Even if the software does not
meet the above requirements, a textile business should depreciate it over 36 months if it was not
acquired in connection with the acquisition of all or a substantial part of a business.Anyone who
acquires software today must amortize it over 15 years (rather than depreciate it) if it does not
meet all of the requirements listed above and if the taxpayer acquired it in connection with
acquisition of a substantial portion of a business.It appears unlikely that there will be any
significant changes in our tax laws in the foreseeable future. The Clinton administration and
Congress are fighting over the disposition of the projected budget surplus and concerned with
saving Social Security and Medicare.Clintons Year 2000 budget calls for raiding taxes and expanding
government programs by cracking down on corporate tax shelters and cashing in on the settlement
between tobacco companies and U.S. states.Congress has adopted a budget outline that calls for
using the mounting budget surplus in Social Security payments to reduce the nations $3.3 trillion
in publicly held debt. The almost identical Senate and House budget plans would keep the strict
spending limits laid out in the 1997 balanced budget pact, leaving room for significant tax cuts or
new spending. Controversial Tax BreaksIn recent months, textile mills and business owners have
seen more than their fair share of controversial court decisions and Internal Revenue Service (IRS)
rulings involving key tax breaks. These included reversals by the U.S. Tax Court, dissenting
opinions and differing positions among the various appeals courts. And behind it all, the IRS
quietly pushes its agenda. Personal vs. BusinessTemporary rules issued by the IRS disallow a
tax deduction for the interest paid on overdue individual income taxes, even when the source of the
personal income is a trade or business.A 1996 Tax Court decision, held that the applicable
regulation conflicts with the Tax Court decision, several lower courts have sided with it in
finding the IRSs regulations to be invalid.Unfortunately, the U.S. Court of Appeals for the Ninth
Circuit, in a 1998 decision, overturned the Tax Court and concluded that the regulation is a
reasonable interpretation of a finically ambiguous statute. The Eighth Circuit the only other
appeals court to address the issue has also sided with the IRS. Although the question of tax breaks
for interest paid on the unpaid taxes of a mill owner is a narrow one, more controversial and
somewhat closer to home is the on-going problem of who is and who isnt an independent contractor.

 Employee vs. ContractorThe big news here has been the rulings in the Microsoft vs.
Vizcaino case, preventing the software manufacturer from withholding benefits from workers it has
classified as freelancers.A divided Appeals Court for the Ninth Circuit upheld a three-judge panel
decision that workers classified by Microsoft as freelancers were entitles to participate in the
companys 401(k) and Employee Stock Purchase (ESOP) Plans.The employees in this case signed
employment contracts as independent contractors even though they all worked at the company for
years and performed the same work as permanent employees.It is not just high-tech companies, which
typically use larger numbers of such freelancers in code and software design, that will be affected
by this case in 2000.All businesses that give workers benefits and provide flexible work
arrangements must take note; and workers must review how many classifications will impact on 2000
contributions to both IRAs and employment taxes.On that age-old basic question of who is and who
isnt an independent contractor, however, the IRSs 20-point test and the safe harbor rules for
textile-related business operations remain intact.Although a few lawmakers have proposed making the
question of who is and who isnt easier, it appears unlikely that anything will happen to resolve
this issue completely.In an important pro-taxpayer ruling, reliance on legal tax advice triggered
safe-harbor relief. The IRS ruled in technical advice that a vision care companys reliance on legal
advice established a reasonable basis for not treating doctors of optometry as employees. A mill
that received similar advice would also, presumably, be allowed to continue treating its workers as
independent contractors. Capital Expense Or Just ExpenseEvery mill or business owner is aware
that expenses can be deducted immediately while those expenditures that are required to be
capitalized must be depreciated if they can be deduced at all.However, the IRS shows every intent
of continuing in 2000 to aggressively apply a 1992 Supreme Court decision to require capitalization
of many expenses.Business acquisition costs: Here the IRS has also decided that once a decision has
been made to acquire the business, virtually all costs incurred in an attempt to actually acquire
it are ineligible for five-year amortization and must be capitalized only to be recovered when the
business is eventually sold or otherwise disposed of.Asbestos removal cost: The Tax Court has
required costs for the removal cost of asbestos to be capitalized.Graphic design costs: The IRS did
lose one of its capitalized expenditure cases the Tax Court denied its attempt to require the
capitalization of graphic design costs for cigarette packages even though they may produce future
patronage or goodwill. Unfortunately, the IRS has announced that it will still pursue those who
attempt to deduct graphic design costs as advertising expenses rather than capitalizing them.

 Questionable Tax BreaksOne of the basic principles of operating a textile business as a
corporation permits a shareholder to contribute capital to the incorporated business without
recognizing gain on the exchange. However, when it comes to contributing property with liabilities
in excess of its basis or book value, gain must be recognized to the extent of the excess.In an
about-face, the Tax Court in another case decided that excludable discharge-of-indebtedness income
realized by an insolvent S corporation does not flow through a shareholder in the form of any
increase in stock basis.Partnerships: Noting what it calls a rising level of abuse, the IRS has let
it be known that it intends to vigorously pursue valuation issues involving family limited
partnerships. The IRS is particularly concerned about dramatic discounts that have been taken for
family limited partnerships when the partnership assets consist of cash, cash equivalents,
marketable securities and similar liquid assets.Electronic travel records: As an accommodation to
todays increasingly paperless economy, the IRS interpreted the documentary evidence rule to not
require an original document, such as an airline ticket receipt, provided an employee also
established the amount, date, place and business character of the expenditure. Reducing
Taxable IncomeMany times a textile, apparel and fibers business owner can legitimately deduct
benefits that would otherwise be classified as nondeductible personal expenses. No textile business
owner should overlook the possibility of purchasing health insurance, investing for retirement or
providing perks like a company car through the business. But perks, particularly those that benefit
the owner of a closely-held textile operation, require advance planning.It should be kept in mind
that claiming some tax deductions may have an impact on the textile operations taxes in later
years. A good example of this is the recapture or payback of certain depreciation deductions that
are required when business property is sold. Depreciation deductions begin in the tax year in which
property is placed in service. Merely buying depreciable property during 1999 is not enough. To
claim the depreciation deduction, the property must be put into productive use in the fiber,
spinning or weaving business before the end of the year.All business real estate must be
depreciated using a mid-month convention. The property is treated as being placed in service in the
middle of the month in which it is actually placed in service. A depreciation deduction for
one-half of that month, plus the rest of the months for the remainder of the year. For most other
depreciable property other than real estate, a mid-year convention is used. This means that
regardless of what month the textile business starts using the property, it is treated as if use
began in the middle of the year. Generally, that means one-half of the first years depreciation,
regardless of when the property was placed in service.If Uncle Sam will allow one-half years tax
break for asset purchases made at anytime of the year, why not purchase all business assets and put
them to use in the final days of DecemberThat strategy would give you a half-years depreciation
while at the same time, avoiding an actual cash outlay until late in the year. The IRS is aware of
this possibility and imposes a so-called mid-quarter convention to prevent everyone from doing just
that.The mid-quarter rules apply if a textile mill puts more than 40 percent of their total newly
acquired property for the year into service in the last quarter. Any mill or business that does,
must use the mid-quarter convention for all assets placed in service during the year. Plan To
Pay The PiperEvery employer is required to withhold taxes from employees pay as well as deposit the
withheld amounts with the property tax agencies. Furthermore, as an employer, a textile operation
will also have to pay certain taxes on the amount paid to workers.Together, these taxes that every
operation is required to withhold and those that they are directly required to pay compromise the
operations payroll taxes. They may include Federal, state and perhaps, local income taxes, Social
Security, Medicare taxes, Federal and state unemployment taxes and, in some states, disability
insurance taxes.Plus, regardless of whether the textile operation employs others, some payroll-type
taxes due on income that the owner receives from the business. The key to controlling payroll tax
obligations is making all payments when they are due in order to avoid getting hit with costly
penalties.

 Tax CreditsWhen they are available, tax credits are generally better for a textile
business than deductions. After all, credits reduce the apparel or fibers operations tax bill while
deductions merely reduce the income which that tax bill is computed.Today most tax credits are
narrowly targeted to encourage everyone to take certain actions that lawmakers have deemed
desirable (generally, to benefit disadvantaged low-income individuals or the environment). There
are also a few credits designed to prevent double taxation and a few designed to encourage certain
types of investments that are considered socially beneficial. Lower Tax RatesAlthough no
textile business or operation can actually lower its tax rate, there are opportunities that can
produce similar results in 2000:Choosing the optimal form of organization for the business (such as
sole proprietorship, partnership, corporation or S corporation.)Structuring a transaction so that
payments received are classified as capital gains. Long-term capital gains earned by non-corporate
taxpayers are subject to lower tax rates the other income.Shifting income from a high tax bracket
individual (such as the textile business owner) to a lower-bracket individual (such as the owners
child). One fairly simple way to accomplish this is by hiring your children. Another possibility is
to make one or more children partners in the textile business, so that net profits are shared among
a larger group.While the tax laws limit the usefulness of this strategy for shifting unearned
income to children under the age of 14, some opportunities to lower tax rates still do exist. But,
once again, the time to think about those strategies is during 1999, not 2000. Planning To
Avoid The AMTBecause some taxpayers most notably wealthy taxpayers have been so successful at
legally minimizing their taxbills, Congress came up with another way to tax them: the alternate
minimum tax (AMT). The AMT ensures that every textile business and individual will pay a tax no
matter how successful they are at using the benefits, deductions and credits in our tax law.If a
mill or textile business owner is too successful at planning his or her taxes using so called
preference items such as acceleration depreciation, capital gains, etc., the AMT is triggered.

 Restrictions On Tax PlanningThe fact that a textile operation plans to use one form of
transaction rather than another in order to minimize taxes will not invalidate the transaction for
tax purposes. However, even if the form of a transaction is valid, the IRS may look at the
substance or true nature of the transaction in order to determine what the tax consequences should
be.The general rule is that the IRS may look behind the form of any transaction in order to
determine its substance for tax purposes. If the IRS doesnt agree with the taxpayer, they are
empowered to change that deduction. Taxpayers, however, are generally locked into the form of the
transaction. The thinking here is that since a taxpayer can freely choose how to set up a
transaction, its only fair to require him or her to live with the tax consequences.Despite the
restrictions and despite the fact that there will not, in all likelihood, be any significant tax
law changes to the plan for, everyone should immediately begin thinking how to reduce their 1999
income tax bills, those bills that will become due early in 2000.Incorporating tax planning into
the day-to-day operation of your textile business will enable you to achieve a low tax bill this
year and low tax bills for the next few years at least.

May 1999

AAMA Strengthens Government Relations

The American Apparel Manufacturers Association (AAMA), Arlington, Va., has made bold moves to
improve its government relations program.First, it has formed a formal Government Relations
Division, which will be headed by Steve Lamar. The AAMA has also retained the services of the
Duberstein Group, one of the leading political consulting groups in Washington, D.C.The AAMA has
been involved in the reducing and lifting the tariffs on sewing machines and other apparel
manufacturing equipment and parts imported into the United States.AAMA continues to be involved in
trying to persuade Congress to adopt NAFTA equivalency for the Caribbean Basin countries.

May 1999

Shell Chemicals And KoSa Form Marketing Company

Shell Chemicals and KoSa have announced they have formed a marketing organization to answer
consumer demand for stain-resistant, durable products with outstanding stretch and recovery
properties by speeding the global availability of Corterra polymer-based materials.The Corterra
Polymer marketing organization will be headquartered in Houston, and will focus immediately on
marketing Corterra as polymers, fibers and yarns.Corterra is the trade name for polytrimethylene
terephthalate (PTT), a thermoplastic that can be spun into fibers. Some end uses include carpet,
garments, home furnishings and automotive fabrics.The new company will be owned equally by Shell
Chemical and KoSa. Final contracts and legal documents for the new entity are expected to be signed
soon. It will target the carpet, home furnishings, apparel, automotive and industrial sectors in
North and South America. Shell Chemicals will retain its PTT licensing worldwide and will continue
marketing and sales activities outside the Americas.

May 1999

Future Focus 39 99 Seminar Pinpoints Dramatic Changes

As one of the featured speakers of Future Focus 99 Individuality, the annual seminar sponsored by
the N.Y. Home Textiles Show, Elissa Moses, director of GlobalandMarket Intelligence, Phillips
International, provided the larger context for the dramatic changes in home fashion, lifestyles,
marketing and retailing that will characterize the new millennium.In a digital age that provides
instant access to style trends anywhere in the world, the changes occur at a dizzying pace, she
noted.Moses predicts that by 2010, half of U.S. stores will close, as more and more buying is done
over the web, which will account for 25 percent of all retail purchases by 2005.Global
InfluencesJune Weir, co-founder of the Weir/Wolfe Report and former fashion editor of Womens Wear
Daily, noted that some of the new trends are already taking place.One of the most important
megatrends says Weir is Ethnic, inspired by increasing globalism and world travel. Its a melting
pot of opportunity characterized by exuberance in color, shape and texture. Individuality is the
key. The home becomes a very personal place filled with furnishings and accessories that recapture
a feeling or meaningful experience.Weir predicts lots of red, rich, decorative textures and
patterns, and cherished objects and collectibles culled from around the world to express ones own
individuality.Leather will be very big in upholstery, also knitted throws, ethnic pillows. Bamboo,
rattan and wicker will be important, and the chaise lounge is coming back.Weir referred to a new
type of millennium woman worldly, sophisticated and well-traveled, who will fill her home with
furnishings, accessories and fabrics that reflect a mix of cultures from the primitive to
traditional, drawn from many eras antiquity to modern.A second key trend according to Weil relates
to Energy colors, patterns and textures that are dynamic, that energize a home. She spoke of Chi
colors sun-drenched yellows and luminous blues; new proportions in furniture (longer, movable,
sectional); lots of cushions; chrome or stainless steel foundations for an airy, floating look;
shiny textures and surfaces; mirrors; and living plants and shrubs for environmental
affirmation.The third megatrend envisioned by Weir is called Ethereal. It reflects a simpler way of
living, the home as sanctuary, a tension-easing place that invites meditation and relaxation. The
softer, rounder, well-cushioned furniture cited as key to the first two trends is also important
here, along with lush, plush textiles, velvets, and silky, iridescent and translucent fabrics.A
return to nature will be evidenced in leaf patterns as a major motif, as well as marine inspired
colors, shapes and patterns, particularly seashells.Color ForecastThe Future Focus 99 Color
presentation was broken down into three major color groupings: Sophisticate;
SpiritualistandTraveler; and TraditionalistandBohemian.Sophisticate is geared to city dwellers,
seeking serenity and simplicity from an outer life of chaos. It will focus on a softer palette of
neutralized mid tones, grays, whites and pales to achieve a new sense of minimalism in the home.
Spiritualist also invokes the Asian aesthetic with precious pales, soft cosmetic hues, pearlized,
opalescent and metallicized tones and textures. In this category are also brushed surfaces,
white-on-white, flesh tones, ombre effects, organza, wovens and brocades in soft
pales.Traditionalist focuses on colors like yellow, blues, white, turquoise, gray, aubergine and
malachite, with a comfortable mix of styles Persian patterns with country plaids and ancient
Southwest motifs with delicate florals.For the Bohemian half of this color group, unconventional,
non-conforming combinations are the rule. Important here will be pinks, chartreuse, purple, gold,
aqua and citrus greens in a variety of combinations reflecting various influences from retro and
hippie to childhood.The Future Focus 99 Color presentation was promulgated by a special industry
committee comprised of: Chairperson Renee Bennett, editor-in-chief, LDB Interior Textiles Magazine;
Judith Douglass, Douglass International Design; Molly Vanden Bosch, Cotton, Incorporated; Leatrice
Eiseman, executive director, Pantone Color Institute; and Carol DArconte, Color Portfolio. by Trudi
Novina, New York Correspondent.

May 1999

Outlook For U S Cotton 1999

Cotton Economics Outlook For U.S. Cotton 1999
The National Cotton Council takes its annual look at the forces shaping the U.S. Cotton
Industry.

Editor's Note: This article is a compilation of excerpts taken from the National Cotton
Council's Report titled “The Economic Outlook For U.S. Cotton 1999” prepared by Mark Lang,
Director of Economic Services; Kent Lanclos, Agricultural Economist; Kevin Brinkley, Agricultural
Economist; and Deborah Vivien, Agricultural Economist.
 We begin the last year of the
millennium having just experienced an extraordinary year of extremes. Events in the past year bring
more than the usual degree of apprehension regarding prospects for the year ahead.The year 1998
held some of the greatest variations in recent times for exchange rates, stock exchange values,
commodity prices and weather. These movements obviously have a direct bearing on the economic
prosperity and security of most enterprises, especially those involved with cotton.  U.S. Net
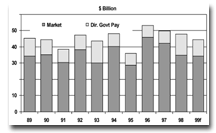
Farm IncomePlunging commodity prices have resulted in a $5.4 billion decline in U.S. net farm
income since the recent record level of $53.4 billion in 1996. U.S. net farm income estimated for
1998 is 11-percent below net farm income of 1996. The basic components of net farm income are
revenue from marketings and direct government payments. In 1996, marketings accounted for $46.1
billion and government payments were $7.3 billion. USDA estimates marketings in 1998 at just $35.1
billion, down $11 billion from just two years ago.A dramatic increase in government payments of up
to $12.9 billion for 1998 prevented a total disaster to net farm income. The 1998 agricultural
disaster assistance legislation added $4 billion to 1998 government payments and $2 billion to
expected government payments for 1999. 

 U.S. Cotton SupplyThe 1998 U.S. cotton crop is best described as a disaster. A cool,
wet spring in the West delayed planting and inhibited crop development throughout the growing
season while drought and scorching temperatures plagued the Southwest. In the Southeast and
Mid-South the culprit was inadequate rainfall bordering on drought in many areas. The result has
been a crop much smaller than early-season projections of 16 to 17 million bales.Since
implementation of the Federal Agriculture Improvement and Reform Act (FAIR Act) of 1996, U.S.
upland cotton acreage has declined significantly, spurred by price relationships which have favored
alternative crops such as corn and soybeans.Under the previous farm bill (the Federal Agriculture
Conservation and Trade Act or FACT Act), which was in place for the 1991 through 1995 crops, upland
cotton area averaged 14.06 million acres.In the Southeast, growers planted 3.08 million acres of
upland cotton in 1998, a small decline from the previous year but significantly above the 1991 to
1995 average of 2.09 million acres. The region has planted in excess of three million acres every
year since 1995.Behind the rebound in the regions cotton acreage has been the highly successful
Boll Weevil Eradication Program (BWEP) which brought this notorious cotton scourge under control.
The 1998 Cotton Insect Loss Survey indicates that only 1,500 acres were infested with boll weevils
in 1998.Growers in Georgia planted 1.40 million acres in 1998, a decline of 40,000 acres from the
previous year. Acreage also declined moderately in Alabama (down 40,000 acres to 495,000), Florida
(down 11,000 acres to 89,000) and Virginia (down 9,000 acres to 92,000).Growers in North Carolina
increased cotton area by 20,000 acres to 710,000. Plantings were unchanged in South Carolina at
290,000 acres.Upland area in the Mid-South declined to 3.23 million acres in 1998, the smallest
plantings since 1989 and well below the 4.29 million acres averaged under the FACT Act.Price
relationships unusually favorable to corn and soybeans, along with the increasing cost of boll
weevil control, have been the primary factors behind the decline in the regions acreage.
Approximately 2.9 million acres of cotton in the region were infested with boll weevils in 1998,
almost 77 percent of which required treatment.Growers in Arkansas planted 920,000 acres of upland
cotton in 1998, a decline of 60,000 from the previous year. Acreage in Louisiana declined 120,000
acres to 535,000. Smaller reductions were noted for Mississippi (down 35,000 acres to 950,000),
Tennessee (down 40,000 acres to 450,000) and Missouri (down 25,000 acres to 370,000).In the
Southwest, 1998 upland cotton area increased modestly to 5.83 million acres, about 400,000 acres
below the average from 1991 to 1995. However, unusually large plantings of over 6.70 million acres
in two years of that time frame biases the comparison.A steady decline in Oklahoma acreage accounts
for much of the systematic reduction in the regions acreage, with the states growers planting only
160,000 acres in 1998, down 40,000 from the previous year. Furthermore, the states 1998 acreage is
the lowest on record.Growers in Texas planted 5.65 million acres in 1998, an increase of 150,000
acres from the previous year and approximately equal to the states 5-year average. In Kansas
growers planted 17,000 acres, up 5,000 acres from the previous year.Upland area in the West
declined 315,000 acres to 960,000 in 1998, the lowest plantings since 932,000 acres were planted in
1967 and 495,000 acres below the 1991 to 1995 average. California accounts for much of the decline,
with upland plantings of 650,000 acres, a reduction of 230,000 acres from 1997 and 410,000 acres
below the 1991 to 1995 average. Behind the states decline in acreage is a shift to permanent crops,
forages and ELS cotton.Arizona upland area of 250,000 acres represents a decline of 70,000 acres
from 1997 and is 86,000 acres below the average under the FACT Act. In New Mexico, growers planted
60,000 acres in 1998, 10,000 acres below the previous year but 1,000 acres above the 1991 to 1995
average.ELS area in 1998 was 330,000 acres, an increase of 80,000 acres from the previous year.
This increase is misleading, however, in that about 70,000 of the 105,000 acres of ELS cotton
planted in Texas had little chance of developing.California growers planted 200,000 acres of ELS
cotton, a moderate increase from the previous year but below expectations as the cool, wet spring
prevented some acreage from being sown. Arizona ELS area continued to decline, with growers
planting 16,000 acres, a decline of 6,000 from the previous year and the states lowest ELS area
since 2,600 acres were planted in 1949. In New Mexico 9,000 acres of ELS cotton were planted, a
small decline from both 1997 and average ELS plantings. Harvested AcreageTypically about 6
percent of the cotton acres planted in the U.S. are abandoned due to adverse environmental factors
such as drought, excess rain, hail and disease.In 1998, however, abandonment exceeded 20 percent
(2.70 million acres) as Texas growers abandoned 2.35 million acres of upland cotton due to drought,
over 41 percent of the states acreage. Abandonment of upland cotton acreage in the state is
typically on the order of 12 percent. In addition, about 70,000 acres of ELS cotton were abandoned.
Oklahoma growers abandoned 40,000 acres (20 percent of the crop) due to drought, not quite double
the states usual abandonment rate.Overall, harvested acreage in the Southwest was 3.44 million
acres in 1998 for an abandonment rate of about 41 percent and accounting for 2.39 million acres of
the total 2.70 million abandoned. In Georgia, poor growing conditions forced growers to abandon 6
percent of their crop (80,000 acres), up considerably from an average abandonment rate of about 1
percent.California growers abandoned 5 percent of their upland crop (30,000 acres) due to adverse
environmental conditions. Abandonment has averaged less than 1 percent in the
state. YieldsCrop development and condition were adversely impacted across wide swaths of the
cotton belt. The extreme heat led to more rapid crop development than normal. However, excessive
heat and inadequate moisture placed plants under severe stress, leading to unusually large boll
shed and poor crop condition. The stress took a significant toll on yields.USDA estimates the
national average upland yield for 1998 to be 612 pounds per harvested acre compared to a 5-year
average of 636 pounds. Most states also came in significantly below average. The national average
ELS yield is estimated to be 873 pounds, down 90 pounds from its 5-year average. As a result, the
national average all cotton yield for 1998 is estimated to be 618 pounds, 24 pounds below its
5-year average.The average yield in the Southeast is estimated to be 598 pounds, well below the
5-year average of 652 pounds.The largest decline occurred in Florida where the estimated yield of
408 pounds is 196 pounds below the states 5-year average. In Georgia, the shortfall is 124 pounds
while South Carolinas yield is 76 pounds below normal.A more modest decline in yield occurred in
Alabama where the 1998 yield of 576 pounds is 24 pounds below the 5-year average.In contrast,
yields were higher than average in North Carolina (plus 64 pounds) and Virginia (plus 35 pounds). A
varied regional picture is also evident in the Mid-South where the 1998 estimated yield of 638
pounds is 57 pounds below the regions 5-year average.

 In Louisiana the estimated yield of 590 pounds is 97 pounds below the states 5-year
average due to widespread drought.In Missouri the shortfall is 198 pounds, with the states yield an
estimated 471 pounds. A yield shortfall of 83 pounds is reported for Arkansas.Higher than average
yields are reported for Mississippi (plus 10 pounds) and Tennessee (plus four pounds).In Texas, the
average upland yield is estimated to be 509 pounds compared to a 5-year average of 455 pounds. In
Oklahoma, the effect is much more pronounced with an estimated yield of 560 pounds, 233 pounds
above the 5-year average. In Kansas, the estimated yield of 402 pounds exceeds the 5-year average
by 4 pounds. The upland crop in the West was hit hard by a cool, wet spring as reflected in an
estimated yield of only 943 pounds, 204 pounds below the regions 5-year average.Hardest hit was
California where USDA estimates a yield of 890 pounds, down from a 5-year average of 1,162 pounds
and the lowest yield since 1978s yield of 640 pounds.In Arizona the estimated yield of 1,123 pounds
is 53 pounds below the 5-year average. In contrast to the other states in the region, the estimated
yield in New Mexico of 745 pounds is 47 pounds above the 5-average. The decline in ELS yields is
largely attributable to California where the estimated yield of 920 pounds is 166 pounds below the
5-year average due to the same factors that proved detrimental to upland yields.In Arizona the
estimated yield of 743 pounds is 43 pounds below average. Whereas upland yields in New Mexico are
well above average, ELS yields are well below average with an estimated yield of 587 pounds, some
120 pounds below the 5-year average.Texas ELS yields are also below average, with an estimated
yield of 750 pounds, down from a 5-year average of 814 pounds. ProductionUSDAs most recent
estimate places the 1998 U.S. cotton crop at 13.80 million bales. Classing data indicates, however,
that the crop will be somewhat larger at about 14 million bales.Regardless, this years crop will be
down sharply from the 18.79 million bales produced last year and the 5-year average crop of 18.29
million bales.Upland production is estimated to be 13.37 million bales, a decline of 4.88 million
bales from last year. Placed in a historical context, the 1998 upland crop is the smallest since
the 1989 crop of 11.50 million bales. The ELS crop is also significantly smaller with production
estimated at 430,000 bales, down 118,000 bales from 1997.Insect pressure was severe in many areas
of the cotton belt, as a relatively warm winter failed to reduce overwintering pest populations
significantly.The 1998 Cotton Insect Loss survey reveals that approximately 1.76 million bales of
cotton were lost to insects across the cotton belt in 1998, almost 13 percent of the roughly 14.0
million actually produced.The bollworm/budworm complex accounted for the greatest losses at almost
600,000 bales, or 37 percent of the total, followed by boll weevils at approximately 500,000 bales,
29 percent of the total, and lygus accounted for 230,000 bales, or 13 percent of the total
losses.The economic value of the cotton lost from all pests is estimated to be about $550 million,
assuming an average price of 65 cents/lb. In addition, treatment costs are estimated to be another
$675 million, for a total economic loss to cotton producers of about $1.23 billion in 1998.The 1998
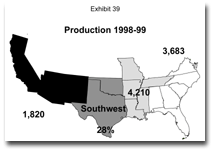
upland crop in the Southeast is estimated to be 3.68 million bales. This represents a decline of
382,000 bales from last year, largely attributable to reduced yields in the region. Compared to the
5-year average, however, the 1998 crop represents an increase of 54,000 bales. Demonstrating the
regions growing importance to U.S. upland production, about 28 percent of the nations upland crop
was accounted for by the Southeast, up from the 1991 to 1995 average of 16 percent.Approximately
343,000 bales of cotton were lost to insects in the region in 1998, with bollworms/budworms
accounting for about 68 percent of the lost bales and fall army worms accounting for another 12
percent.The upland crop in the Mid-South is estimated to be 4.21 million bales, the smallest crop
this decade by almost 500,000 bales and over 1.60 million bales below the regions 5-year
average.Responsible for the decline in production is the shift in acreage to grains and below
average yields due to inadequate rainfall. In 1998, the region accounted for 31 percent of the
nations upland crop, a moderate decline from the 1991 to 1995 average of 36 percent. Insect losses
in the region were over 609,000 bales in 1998.The bollworm/budworm complex accounted for 47 percent
of the lost production and boll weevils accounted for another 25 percent.The Southwest was the
region hit hardest by weather as reflected by its 1998 upland production estimate of only 3.65
million bales. This represents the regions smallest crop since 1992 production of 3.48 million
bales and a decline of about 1.33 million bales from the 5-year average.During the 1991 to 1995
period, the Southwest produced about 28 percent of the U.S. upland cotton crop; for 1998, the
region will also account for about 28 percent.Boll weevils accounted for 60 percent of the 588,000
bales of cotton lost to insects in 1998, with bollworms/budworms a much smaller factor at 12
percent. Upland production in the West is estimated to be 1.82 million bales, the smallest crop
since the region produced 1.72 million bales in 1971. This also represents the first time since
1986 that the region has produced less than three million bales of upland cotton.In 1998, the West
accounted for 14 percent of the upland cotton crop, a significant decline from the 1991 to 1995
average of 21 percent. Lygus was the primary culprit behind the regions insect losses in 1998,
accounting for 64 percent of the 218,000 bales lost. Spider mites accounted for another 20 percent
of the insect losses.ELS production in Arizona is estimated to be 24,000 bales, the smallest crop
since 1955, as the states growers continue to switch to alternative crops. The California ELS crop
is estimated to be 345,000 bales which would be the third largest on record. Had yields not been
significantly below average, the state would likely have produced at least its second largest ELS
crop ever.ELS production in New Mexico is estimated to be 11,000 bales, significantly below the
5-year average of 18,000 bales due to lower yields. Texas ELS production is 4,000 bales below the
5-year average at 50,000 bales, again due to lower yields. Raw Cotton ImportsExpectations are
that Step 3 import quotas opened the first week of March 1999. The USDA currently projects that
U.S. textile mills will import approximately 350,000 bales of cotton during the 1998 marketing
year. Indications are, however, that imports will be somewhat larger, perhaps around 500,000
bales.When Step 3 quotas were last open, U.S. textile mills imported about 330,000 bales during the
1995 season and an additional 450,000 bales during the 1996 season.Of the 780,000 bales imported
during this period, approximately 660,000 were landed between June and September of 1996 as mills
used imports to bridge the shortage of U.S. cotton experienced during the transition between
marketing years.Even though importation of foreign cotton virtually ceased by December 1996, Step 3
quotas continued to trigger until May 1, 1997. Under the Step 3 provisions, mills had until
December 12, 1997 (180 days) to land foreign cotton under this last weekly quota. While the ability
to land foreign cotton existed for virtually all of calendar 1997, less than 10,000 bales were
actually imported.

 Stock LevelsUSDA currently projects U.S. ending cotton stocks for 1998 of 3.20 million
bales, a decline of about 700,000 bales from the stock levels of the two previous years.However, it
appears that ending stocks could actually be in the range of 3.90 million bales, given the growing
weakness in domestic and export demand and a crop that has proved larger than harvest-time
expectations.With current levels of offtake and ending stocks of 3.20 million bales, the ending
stocks-to-use ratio (SUR) for 1998 would be 21.6 percent, slightly above the 20.6 percent recorded
for 1997. With 3.90 million bales of ending stocks and somewhat lower levels of offtake, the ending
SUR could end up around 27 percent.When cotton prices were strong during the 1994 and 1995 crop
years, the corresponding SURs were 12.9 percent and 14.2 percent (inclusive of imports),
respectively. Summing beginning stocks, production and projected imports for the 1998 marketing
year gives a total supply of 18.03 million bales, down from 22.78 million in 1997.This marks the
smallest available supply since 1985 when total supply was 17.57 million bales. Over the past five
years, total supply has averaged 21.94 million bales.U.S. Cotton Mill Use Million Bales

 Upland Cotton QualityAdverse environmental conditions not only led to a smaller crop in
1998 but also proved detrimental to the crop quality. On a national basis, 70.8 percent of the crop
graded 41 or better, a small decline from 71.3 percent last year.The percent of the crop grading 31
or better, however, declined far more substantially with 44.0 percent receiving at least a middling
grade in 1998, down from 55.9 percent last year.On a regional basis, the most significant decline
in color occurred in the Mid-South where only 61.7 percent of the crop graded 41 or better, down
from 86.7 percent in 1997 with much of the decline occurring in the higher grades.In the Southeast
and Southwest, the percent of the 1998 crop grading at least 41 is actually a moderate improvement
from last year. In the West, the percent of the crop grading at least 41 is virtually identical to
last year.Average staple and strength also declined in 1998 in most regions. The national average
staple in 1998 is 34.3, down from 35.1 in 1997. The national average strength is 28 grams/tex, down
from 29 last year.Strength is down by at least 0.6 grams/tex in all regions, with the West again
the exception. Micronaire has increased substantially from last year with a national average mike
in 1998 of 4.47 compared to 4.27 last year. Micronaire is significantly higher in all regions
except for the West where it is the same.  CCC Loan StocksFollowing harvest of the 1997 crop,
CCC loan stocks grew to approximately 2.7 million bales in January 1998.The Mid-South accounted for
63 percent of the outstanding loans, the Southwest 29 percent, the Southeast 6 percent and the West
accounted for the remaining 2 percent at this point.As loan redemptions began, outstanding loans
declined to below two million bales in March. In April, however, the AWP fell below base loan rate
and, as a result, producers and cooperatives placed additional quantities of cotton under loan in
order to have carrying charges paid by CCC.Consequently, outstanding loans increased to almost 2.4
million bales in April. Loan redemption then began again in earnest and, by May, outstanding loans
had declined to just over 200,000 bales. By August, loan stocks had dropped below 50,000 bales.With
harvest of the 1998 crop, loan stocks again began to grow, reaching 3.4 million bales by
mid-January. As expected, Mid-South entries dominated, accounting for 46 percent of the outstanding
loans in January. The Southeast accounted for a larger than usual share at 13 percent, and the
Southwest accounted for 23 percent. The remaining 18 percent was accounted for by the
West.Eighty-five percent of the cotton under loan is Form G (coop) while the remaining 15 percent
is Form A (producer).  Cotton PricesUpland cotton prices experienced considerable volatility
in calendar 1998. Using the U.S. average spot 4134 price as a barometer, upland cotton prices began
the year at 63.65 cents/lb., rose to 68.62 by mid-March and then declined to 59.82 in early
April.At this point, a sustained rise in prices began as the extent of the looming crop disaster
came into focus. By early July the spot 4134 price had reached a calendar year high of 77.79
cents/lb. With the extent of the crop losses apparent, the market then shifted its attention to
weakness in domestic and foreign mill demand.In addition, there was growing awareness that Step 2
funds would likely be exhausted by early spring 1999, at the latest, and that Step 3 import quotas
would begin to trigger soon thereafter.In combination, these factors precipitated a slide in upland
cotton prices. By the end of calendar 1998, the spot 4134 price had declined to 57.06 cents/lb., a
drop of 20.73 cents from its July high. The slide continued into calendar 1999 with the spot 4134
price dropping below 56 cents in mid-January.The weakness in cotton prices is a continuation of
market forces which first appeared in late spring 1996. To illustrate this point consider that the
U.S. average spot 4134 price was 86.41 cents/lb. in early June of 1996; a slow decline then ensued
in which the spot 4134 price fell to 77.64 by the end of the 1995 marketing year (July 31,
1996).Weakness continued to plague prices throughout the 1996 marketing year with the spot 4134
price declining to the 68-69 cent range in the spring of 1997 before strengthening modestly toward
the end of the marketing year. Beginning the 1997 crop year at 72.56 cents/lb., the spot 4134 price
generally fell throughout much of the marketing year, reaching a low of 60.74 cents/lb. in late
April of 1997.A planting rally then drove an increase in prices with the spot 4134 price reaching
77.79 cents/lb. in early July. At this point, growing expectations of a large U.S. crop began to
undercut the price momentum and forced the price down to 71.36 cents/lb. by the end of the 1997
marketing year.The decline in cotton prices has not been confined to the U.S. Comparing the spot
4134 price with the A Index and the nearby NYCE contract since January 1, 1995 shows that movements
in the three price series have largely tracked one another, indicating that each has been pressured
by the same market forces.Basically, the decline in U.S. and world cotton prices is a function of a
growing world supply-demand imbalance a surplus of cotton in the international market.During the
1996 crop year, the world SUR climbed above 40 percent, a level generally deemed to indicate a
significant oversupply situation. It was no coincidence that cotton prices began to weaken when
this level was exceeded.The pressure on cotton prices intensified in the 1997 marketing year, with
the world SUR climbing to almost 47 percent; the pressure has not been relieved in 1998 as the
world SUR has surpassed 47 percent.The ongoing Asian financial crisis has only intensified the
pressure on cotton prices. Numerous Asian economies experienced depression-like conditions in 1998,
and the prospect for a quick recovery is dim. As a result, demand for cotton and cotton products in
the region has been battered.The Councils Economic Services has estimated that retail demand for
cotton in Asia has been reduced by 4 to 5 million from levels that would otherwise have been
achieved in 1998.This decline in demand is due both to market share losses to cheaper fibers as
well as the outright loss of consumer purchases because of rising unemployment and lower incomes
across much of Asia. Prices of competing fibers, particularly polyester, continue to pressure world
cotton prices, especially in Asia. In late spring 1998, China restricted imports of textile staple
polyester. The impact was immediate and widespread.For six years polyester capacity had grown
rapidly in most of Asia. With the loss of the Chinese market this capacity was forced to seek other
markets, precipitating a price war among producers of polyester staple. As a result, the price of
bulk polyester plummeted to 28 cents/lb. mill-delivered in most Asian markets. Competition in the
raw cotton export market has also intensified. For the first time since 1992, Chinese raw cotton
has been aggressively quoted in international markets with USDA projecting Chinese exports in 1998
of 1.3 million bales. In 1998, the Chinese have largely been absent from the import side of the
business, placing further pressure on world cotton prices and moving China from net importer to net
exporter status.Though the USDA projects that China will import about 650,000 bales in 1998,
purchases to date are consistent with imports of only 250,000 bales. The ultimate volume of Chinese
raw cotton exports in the current crop year are just as large a mystery. China apparently committed
some 1.4 million bales for future export in April 1998. The cotton from that April tender is still
being quoted for delivery according to Cotlook Ltd. Reports from various Chinese government
authorities place the quantity of planned additional exports at 1.4 to 1.8 million bales. Mill
UseAfter healthy growth in 1997, mills faced increasing challenges beginning in early 1998 as the
dollar strengthened against most currencies and less expensive textile imports began reaching the
U.S. market (This situation is elaborated in the textile trade section following). In addition, as
the summer months progressed, it became obvious that funding of Step 2 certificates was likely to
exceed the $701 million allocation set forth in the current farm bill.In order to capture maximum
benefits from the program, mills began spinning cotton without the necessary regard for sales of
products which led to a buildup of inventories and a slowdown of shipments.When the Step 2 money
ran out in December, 1999, some mills were caught off guard having purchased cotton and/or sold
product with the expectation of a healthy certificate, which never materialized.By mid-December,
mills were faced with substantial inventories of product, weak demand locally due to competition
from inexpensive textile imports and weak demand globally due to the Asian crisis.Many mills opted
for extended holiday shutdowns at both Thanksgiving and Christmas and slower startups in January as
they bled down some of the stored product. At this time, it is not clear when monthly levels of
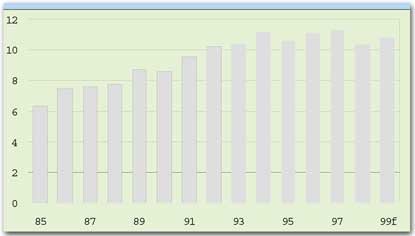
cotton mill use will once again reach levels seen earlier in 1998.Most recent Department of
Commerce figures place domestic mill use in December at an annualized rate of 10.2 million bales,
14 percent below the same time last year. Due to the extraordinary competitive pressures noted
above, NCC estimates 1998 mill use will be 10.4 million bales.Further, with additional Step 2
funding and little relief in the form of a weaker dollar to stem textile imports, mill use is
expected to increase only slightly to 10.8 million bales for the 1999 crop year. If Step 2 is not
funded again, it is estimated that mill use will remain near 10.4 million bales. Most of the
decline in mill use was due to decreases in apparel production.Over calendar 1998, it is estimated
that apparel production in the U.S. will decline nearly 12 percent in light of competition from
imports.Based on industry observation, the two largest categories of end-use production in the
United States men and boys shirts and trousers were the items showing the largest decline.
Fortunately, these are also garments which enter the United States through the 807 and 807a special
access programs of the CBI, allowing a larger U.S. cotton content than other imported
items. Net Domestic ConsumptionMill use is only one indicator of the robustness of the U.S.
market. Another measure is that of net domestic consumption or retail consumption of cotton, which
encompasses not only cotton spun in the U.S. (mill use) but also cotton consumed through textile
imports.After subtracting textile exports (because they are not consumed here), a measure of total
consumption of cotton in the U.S., whether in the raw form or as an end product, is achieved.For
1998, retail use of cotton is expected to reach 18.6 million bales, a 5-percent increase from 1997.
Most of this increase is accounted for by imports of textile products. Imported products made up 66
percent of net domestic consumption compared to 58 percent last year. This is an indication that
U.S. mills have lost significant market share in their own market.Cottons share of all fiber net
domestic consumption remains around 40 percent. Given the expectation that the U.S. economy will
continue to grow, albeit more slowly, in 1999, retail use of cotton is not expected to decline but
remain near the 18.7 million bale mark.Since Asian exchange rates are expected to stabilize or
strengthen somewhat, textile imports should stabilize. With the increase in U.S. mill use offset by
textile exports, it is likely that 65 percent of retail use in the U.S. will derive from textile
imports in 1999. Textile TradeIn past reports, the harshness of increased textile imports has
been lessened by the increased use of U.S. cotton yarn and fabric returning in the imported
finished products.This U.S. content offset some of the harmful effects in the upstream markets. If
an imported shirt was made of U.S. components but only sewn together in another country, it is
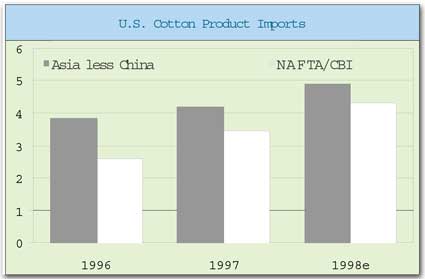
still considered a demand driver for U.S. cotton.It was also noted that the displacement of Asian
textiles by Mexican and Caribbean Basin Initiative (CBI) textiles, which were high in U.S. content,
was a sign that increased textile imports that were constructed of U.S. product could offset the
tremendous pressure from Asian imports.By allowing a price point more in line with the rest of the
world, products containing U.S. cotton were able to increase their global market
share.Unfortunately, the impact of the Asian crisis in 1998 saw a shift back toward Asian and
non-NAFTA/CBI products. This was not a reversal of the trend but was a significant slowdown.With
huge currency devaluations, these countries struggled to find a market for products that were
historically placed in the now recessionary economies of the region. Not only were these products
of Asian origin, but also Indian, Pakistani, Chinese, among others all Southeast Asian trading
partners who lost a substantial market with the collapse of that region and turned to the healthier
economies in the United States and European Union as outlets.As fate would have it, the Federal
Reserves success in keeping the U.S. economy strong was precisely what drew more imports here.Due
to the difficulties facing the Asian consumers and subsequent decline in personal consumption
spending, most of the flailing economies have quickly shifted production focuses toward the export
market.Textiles are no exception. Where some textile markets were only 20-percent export driven,
many are now upwards of 80 percent. Because the domestic demand in these countries has simply
shriveled, there are no increased textile imports to compensate.Countries previously shipping
product within the Asian region now must find new homes for much of the inventory they have or are
now producing (many textile industries do not respond to market indicators, but produce target
amounts regardless of the marketability of the products). Also, an export driven recovery in Asia
is not expected to reap long-term economic stability.In addition to effects of exchange-rate
differentials, the threat of inexpensive man-made fiber continues to accelerate. China has closed
its borders to imports of raw polyester fiber while the entire Asian region continues to build
production capacity of man-made fibers, namely polyester.This has created a glut of polyester fiber
on the world market. At the time of this report, Chinese mills were able to obtain delivered
polyester for 40 cents/lb. compared to an internal cotton price of 80 cents/lb. U.S. mills were
facing a polyester mill-delivered price of 53 cents/lb. for branded polyester and 36 cents for bulk
and 64 cents for cotton. Many cotton-producing countries are now producing textile products for
global and local consumption with a higher man-made content. These products are being sold
domestically to consumers who historically purchased exclusively cotton-rich products.India,
Pakistan and China are all significant cotton growing countries with a tradition of consuming high
cotton content products.Over the last three years, since the buildup of man-made fiber capacity
began, cotton consumption has continually lost ground to polyester. Many analysts expected a flood
of man-made fiber imports into the U.S. once the Asian crisis broke but the data show that cotton
product imports have increased much faster than man-mades.So, where are all these polyester
garments going They are staying in cotton producing countries such as India, Pakistan and China
historically very cotton rich consumers.It is expected that these regions will continue to move
toward an equilibrium consumption pattern that appears closer to that of other less developed
countries in which cotton content has been stifled by the lower prices and more stable supply of
man-made fiber. Textile ExportsThe U.S. trade deficit in textiles continues to widen in 1998,
even as textile exports approach an all-time high of 4.1 million bale equivalents.Through November,
textile exports were up 5 percent over the same time last year. Apparel is the largest category
encompassing almost two-thirds of cotton textile exports. 

AlliedSignal Receives Supplier Excellence Award

AlliedSignal Inc., Morris Township, N.J., announced that Exxon Chemical America has selected
AlliedSignal Specialty Chemicals as one of only six recipients of the prestigious 1998 Supplier
Excellence Award.The award honors AlliedSignal for distinguished performance in the supply of Boron
Triflouride Dihydrate (BF3) catalyst to Exxons Baton Rouge, La., facility within a limited time
frame.The award is given to suppliers that identify and make specific improvements to services,
identify and make efficiency improvements for the mutual benefit of Exxon and the supplier, and
exert effort and skills beyond the call of duty to address a specific problem or challenge.The
challenge was to develop procedures, order packaging and produce the required BF3 in only two
weeks. This required the coordination of AlliedSignals Delaware plant, Buffalo, N.Y., research and
design center and the Morris Township headquarters.This award recognizes not only the quality of
AlliedSignal service, but the quality of our people and the ability to wow the customer and that
makes AlliedSignal a premier company, said Denise Diggs-Kirkland, global director Specialty
Additives.

May 1999

Tarrant Apparel Group Aquires Assets Of CMG

Tarrant Apparel Group, Los Angeles, announced it has acquired certain assets of CMG Inc.CMG
designs, produces and sells private label and CHAZZZ® branded woven (denim and twill) and knit
apparel for women, children and men.Tarrant expects the acquisition to increase 1999 sales to
approximately $470 million and to be immediately accretive to earnings.Charles Ghailian, CEO of CMG
was named as president of Chazzz Division of the Tarrant Apparel Group. He will oversee
developments with customers such as Sears, J. C. Penny and Mervyns.

May 1999

BFGoodrich Shareholders Approve Coltec Merger

Shareholders of BFGoodrich Co., Richfield, Ohio, overwhelmingly approved a merger with Coltec
Industries Inc., Charlotte, N.C.We are bringing together two strong, profitable companies with a
focus on providing innovative solutions and quality products to our customers and creating value
for our shareholders, said David L. Burner, BFGoodrich chairman and CEO.Completion of the merger
requires clearance from the Federal Trade Commission.Also, lawsuits filed by AlliedSignal and Crane
Co. aimed at blocking the merger are pending in U.S. District Court in Indiana. Following
discussions with AlliedSignal, BFGoodrich agreed that it would not complete the merger until the
judge rules on motions to dismiss and to transfer contract issues of arbitration.Once the merger is
completed, Coltec shareholders will receive 0.56 shares of BFGoodrich common stock for each for
each share of Coltec common stock. They will receive written instructions for exchanging their
share certificates. BFGoodrich shareholders will keep their certificates.The value of the
transactions is about $2 billion. The headquarters of the merged company will be located in
Charlotte.

May 1999

DuPont Announces Polyester Joint Ventures

NEW YORK DuPont, Wilmington, Del., recently announced its intent to form two joint ventures to
develop, make and sell polyester with companies in Mexico, Japan and Turkey. A three-way joint
venture with DuPont, Alpek S.A. de C.V. and Teijin Ltd. would market polyester filament yarn in
America. This joint venture is expected to begin operations by the end of the year. It follows last
years DuPont and Alpek announcement to combine their polyester staple fiber businesses.Also, DuPont
and Haci Omer Sabanci Holding S.A., have announced their intent to form a joint venture to develop,
make and sell polyester filament, staple, resins, intermediates, and related products for markets
throughout the European region, the Middle East and Africa. This venture is expected to begin
operations in the fourth quarter. Both joint ventures are subject to regulatory approvals.DuPont
Ventures ForthIn making these announcements, Eduard J. Van Wely, DuPont senior vice president,
said: These are the next steps in our plan to adopt a new business model for DuPonts Polyester
Enterprise based on strong joint ventures. We believe these joint ventures with valued partners are
in the best interests of the marketplace and our shareholders and will enable our polyester
businesses to maximize the efficient use of capital.DuPont would be a 50-percent partner in the
filament polyester joint venture, with Alpek and Teijin owning the remaining 50 percent. The joint
venture will have more than 850 million pounds of capacity and revenues of approximately $600
million. It would include all of the polyester polymer, filament and textured yarn facilities in
Monterrey, Mexico.DuPonts Dacron polyester textile filament facilities at its Cape Fear and Kinston
production sites in North Carolina would be included.According to Jose de Jesus Valdez S.,
president of Alpek, the joint venture does not include Teijin production facilities. Teijin
contribution will be in technology, new product development and marketing innovations.The joint
venture will supply 50 to 60 percent of the polyester filament capacity in North America.
Approximately 50 percent would go to apparel textiles, 25 percent home fabrics and the remainder
specialty products.DuPonts polyester filament business is part of DuPonts Global Polyester
Enterprise, which includes polyester intermediates, staple, fiberfill, films and resins
businesses.DuPont and Teijin recently announced that they will form a 50/50 global joint venture to
make and sell polyester films. On April 1, DuPont-Akra Polyester, a newly formed company
headquartered in Charlotte, N.C., began producing polyester staple fiber for markets primarily in
the Americas as part of a separate joint venture between DuPont and Alpek.Alpek, a wholly owned
subsidiary of Alfa, is one of the largest private petrochemical concerns in Latin America, with
sales in excess of $1.3 billion. Its main areas of business include raw materials for polyester and
nylon, polyester and nylon fibers, polypropylene, polystyrene and polyurethane plastics and
intermediates. Plant modernizations are being considered which would increase spinning capacity
through new high-speed spinning equipment.The DuPont/Sabanci joint venture will have revenues of $1
billion annually and employ 4,500 people. It would include DuPonts PTA (pure terephtalic acid) and
resins businesses at Wilton, United Kingdom and Dacron® filament and staple businesses in
Pontypool, United Kingdom., and Uentrop, Germany.Also included would be Sabancis polyester
filament, staple, resins, bottles and DMT (Dimethyl terephtalate) based in Adana, and other sites
in Turkey and the Sabanci texturizing plant in Garforth, United Kingdom.Strength In NumbersThe
Sabanci Group has combined revenues of $10 billion and is one of the two largest industrial and
financial conglomerates in Turkey and employs approximately 30,000 people and operates in tire and
tire reinforcement materials, insurance, textiles, chemicals and automotive.The group has grown
both through expansion of existing businesses and by the formation of 50/50 joint ventures with
multinationals such as Toyota, DuPont, Phillip Morris and International Paper.DuPont and Sabanci
would form a separate company that will manage this polyester business under a single management
team. It would have full access to DuPont polyester technology and brand management resources,
including brands such as Dacron®, Coolmax®, Melinar® and Lasar+®.According to Van Wely, the joint
ventures were motivated by a consolidating industry world-wide and a recent downturn in polyester
business. Through a network of alliances total polyester revenue is expected to total about $5
billion. by Virgina S. Boland, New York Correspondant.

May 1999

Burlington Announces New Apparel Structure

Burlington Industries Inc., Greensboro, N.C., has announced it is organizing its apparel products
into two strategic groups Burlington PerformanceWear and Burlington CasualWear as part of the
corporate restructuring announced on January 26.The names of these two groups symbolize our focus
on the changing consumer, said George W. Henderson III, CEO and chairman. Were breaking out of the
traditional textile manufacturing mold, when it was assumed that synthetics, wool and cotton had to
be separately organized. That traditional organizational structure limited product innovation and
our ability to respond to changing market trends.Burlington PerformanceWear incorporates the former
Tailored Fashions Division (worsted wool) and the former Klopman Fabrics Division (synthetics).
Burlington CasualWear incorporates Burlington Global Denim and a new unit called Burlington Cotton
Casuals.Henderson went on to say: The product development opportunities are very exciting. In
addition there are obvious cost advantages and more complete service to our customers.

May 1999

Sponsors