Senate’s Version Of Trade Legislation Receives ATMI Support

The version of the Sub-Saharan Africa
and Caribbean Basin Initiative (CBI) approved by the Senate has received support from the American
Textile Manufacturers Institute (ATMI), Washington D.C.

Doug Ellis, president, ATMI, said: “The Senate’s strong support for this particular package
of trade legislation indicates clearly that its approach to CBI and Sub-Saharan Africa trade is the
one that has the best chance of being enacted into law.”

The Senate’s version of the legislation would give duty-free, quota-free treatment to
apparel from the Caribbean and from Sub-Saharan Africa that is made from U.S. yarn and fabric. In
some cases, fabric containing U.S. thread would also allowed.

Ellis also stated that the bill would generate apparel jobs and production in the Caribbean
that would displace Asian apparel imports.

“Two separate studies have shown that under the Senate’s version of the CBI bill, U.S.
textile and textile related employment would increase dramatically — in one study more than
120,000,” stated Ellis. “The study also indicated that under the Senate bill, textile shipments
would increase anywhere from $7 billion to $9 billion over five years.”

Ellis also stated that the adoption of this legislation would ensure that the nations of the
Caribbean and Sub-Saharan Africa would also greatly benefit.

Ellis feels that if the bill is changed, the effects on the American textile industry would
be harmful.

“Weakening of the bill’s textile provisions in conference will have an adverse impact on
U.S. textile jobs and production, and we would have to oppose any outcome that does this.”
(For more on this topic, see Doug Ellis and Carlos Moore’s report, “China And The WTO” in this
issue and “News,”
ATI November 1999.)


January 2000

Chenille Producers Form New Association CIMA

Several of the world’s leading
chenille yarn producers have formed a new association, the Chenille International Manufacturers
Association (CIMA).

Companies founding CIMA are Lonfil and Creafil from Italy, Norgatex of Germany and S&O
and Quaker/Nortex from the United States.

Carlo Longo, Lonfil, was named president of CIMA.


January 2000

Ciba Launches E-Commerce Service For Textile Dyes

Ciba Specialty Chemicals Inc.,
Switzerland, has announced that it has launched its e-commerce service offering customers the
option of ordering textile dyes and pigment.

Ciba also has comprehensive product information and interactive color matching service on
its website.

“Both we and our customers are interested in streamlining processes,” said Jean-Luc
Schwitzguébel, global president of the colors division. “As a leading colors supplier we want to be
in the vanguard of this development.”


January 2000

Nylon Forever First As Synthetic Fiber


D
uPont’s Seaford, Del., facility has witnessed the creation of an enormous world-class
fiber industry including pilot plant assistance in commercializing Dacron™ polyester, the fiber
which eventually would displace nylon as the workhorse of man-made fibers.

DuPont appears determined to maintain Seaford as a world-class competitor and a valuable
participant in the nylon value chain. According to sources, Seaford gradually will evolve from a
fully integrated nylon plant producing a range of deniers for textiles and carpets into a major raw
material supply source for DuPont global nylon facilities.

The company will install modern winding technology in newer facilities and confine Seaford
investment to that needed to increase quantity and improve the quality of flake for DuPont use
around the world. This begs the question: is this the future of man-made fiber production in the
United States?


Nylon In The 90s

Typical of a product well into the
maturity phase of the product life cycle curve, filament nylon has settled into market areas where
it has comparative technical or marketing advantages over competing materials and will not be
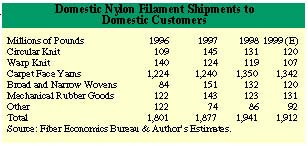
displaced easily by offers of sheer price. As detailed in Table 1, filament nylon shipments today
are a major force in five major market areas defined by fabric constructions.

Obviously, carpet face fibers provide the lion’s share of market opportunities for nylon
filament yarns, with estimated 1999 shipments rising to more than 70 percent of all nylon filament
fibers shipped domestically. All other end uses approximate 110 to 120 million annual pounds each
with some important shifts occurring in the past several years.


Circular Knit

Filament nylon in circular knit
constructions is composed of textured and flat filament yarns in hosiery plus some small amounts of
knit body wear fabrics. After a dramatic rise to more than 140 million pounds by 1995, we predict
hosiery usage of nylon to slip by more than 17 percent to 120 million pounds as the consumer
conducts an anti-pantyhose war.

Nylon hosiery consumption is reduced as control garments containing spandex replace
control-top pantyhose constructions and knee-high stockings appear under increasingly popular
slacks and jeans.

Coincidently, imports of nylon in hosiery deniers also have decreased, suggesting that the
market is oversupplied and prices are weak.


Warp Knit

Nylon use in warp knits has dropped
in the recent past from a high of 140 million pounds in 1996 to 107 million pounds in 1999.
Polyester is the major force behind the shifts. Lingerie and loungewear have converted from
traditional nylon constructions to polyester to take advantage of the recent spate of unacceptably
low polyester filament prices.

Shipments by U.S. producers of fine-denier polyester to warp knitters have fallen 34 percent
to an equivalence with nylon at 107 million pounds in 1999 after outsourcing nylon by as much as 15
percent in 1996.

At the same time, imports of fine-denier polyester (both FOY and POY) have almost doubled
since 1996 with the largest jump, 48 percent, coming between 1996 and 1997 when the Asian economies
headed for the tank. Growth since then has been a more modest 11 percent per year compounded.

It is likely that the nylon and polyester shipments reported above by the Textile Economics
Bureau are understated by diversion of some POY to draw warping constructions for warp knits. It
does not detract from the conclusion that imported polyester filament is having a major impact on
U.S. producer shipments.


Tires And Industrial

U.S. producer nylon shipments to the
mechanical rubber goods (tires plus hoses and belts) industry have settled into a rather monotonous
132-million pound (+/- 8-percent) pattern. Even polyester shipments have succumbed to the ennui,
278 (+/- 3 percent) million annual pounds.

Shipments of high-tenacity nylon have grown by 127 percent since 1996 while shipments of
high-tenacity polyester have grown almost 90 percent.

The absolute value of these increases is more than 81 million pounds, almost 20 percent of
all high-tenacity materials consumed in the U.S.

nylon1_783


Wovens

Nylon is used in a myriad of broad
and narrow woven end uses including lingerie, linings, outerwear, transportation fabrics, luggage
and coated and protective materials.

Nylon use in wovens has suffered from the same polyester pressure as its sister fabrications
of mechanical rubber goods, tires and circular and warp knits. Nylon woven fabrics today enjoy a
market share substantially less than 50 percent of what it was in the ’80s. But, where nylon’s
advantages are allowed to shine it performs well.

The depth and breadth of nylon product lines for woven applications plus the willingness of
producers to develop variants for specific end-use applications have helped maintain nylon’s
position in selected market areas despite polyester’s popularity.


Carpet Face

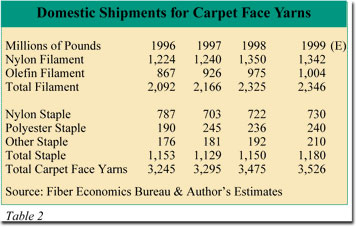
As seen in Table 2, fiber shipments
for carpet face use grew 1.6 percent from 1996 to 1997, another 5.5 percent in 1998 and is
projected to increase another 1.5 percent in 1999. At the same time, total filament shipments to
all end uses grew 4.5 percent in 1997, less than 1 percent in 1998 and are projected to see no
growth in 1999.

Total staple shipments grew 4.5 percent from 1996 to 1997, dropped 2.6 percent in 1998 and,
as with filament, no growth is projected in 1999. Thus, the nylon filament industry, supplying
fibers for carpet face yarns is riding one of the few growth curves in the U.S. man-made fiber
industry.

In 1999 textured filament nylon is the fiber of choice for more than 38 percent of carpet
face fibers, slightly improved from the level achieved in 1994. Filament polypropylene runs second
with a 28.5-percent share, up from 26.7-percent in 1994.

Staple fibers in total still maintain an important position in carpet manufacturing with
total nylon, polyester and olefin products representing approximately one-third of total face fiber
shipments, slightly behind filament nylon and ahead of filament polypropylene.

It is likely that staple’s share will continue to erode as improved filament technology
continues to pressure staple constructions already saddled with the added costs of yarn
preparation.

It is interesting to note that filament nylon’s 1-1/3 billion pounds in carpet face
materials should rise to 23.9 percent of all filament fiber shipments in 1999, up from 23 percent
in 1994.In addition to its technical importance in carpet manufacturing, nylon filament
distribution to carpets is becoming increasingly important to fiber manufacturers.

Because carpet face fibers provide the majority of the nylon producer’s market, new
developments and competitive prices are mandatory to continue this position.

luke2_826


Sustaining Growth

Filament nylon brings value to
several markets, particularly value carpet. These markets are important to nylon producers and add
substantial value to the U.S. economy.

Despite the onslaught of imported manufactured products, it seems that after more than fifty
years, nylon has found its proper homes and is well positioned for continued growth.

Editor’s Note: John E. Luke is owner of Five Twenty Six Associates Inc., Bryn Mawr, Pa., a
consulting firm specializing in strategic marketing and operations facing textile fiber and fabric
manufacturers. He is also a professor of textile marketing at Philadelphia University.


January 2000

2000: Business For The Taking


In Brief

 – Expect a strong economy in 2000. Real GDP will expand by 3.7 percent after a strong
performance in 1999. This means business conditions will be sound, with virtually no risk of a
recession.

– Consumer spending, business investment and exports will drive 2000’s expansion.

– Our trade deficit for goods and services will deteriorate, exceeding $250 billion for the
second straight year.

– For the fourth year in a row, inflation will run under 2.5 percent.

– The Federal Reserve is likely to raise short-term interest rates one more time.

– Hiring will grow at a brisk rate with nonfarm payrolls rising by 2.0 percent after gaining
an estimated 2.2 percent in 1999.

– New homebuilding will be above the 1.5 million mark in 2000 for the third consecutive year.

– Growth in industrial output will pick up speed.

– Textile industry results overall will be mixed this year.

A year ago, the consensus forecast called for a sharp slowdown in U.S. economic growth in 1999,
while some forecasters had expected an outright recession in light of the economic conditions in
the Pacific Region and Latin America. Instead, the concerns turned out to be tight labor markets,
higher oil prices and the possibility of an overheating of the economy.

The Federal Reserve responded by raising interest rates three times for a total of
three-quarters of a point. Growth, estimated at 4.0 percent for 1999, was only slightly below the
1998 booming rate of 4.3 percent and the trend rate of 4.2 percent in the previous three years.

In November, nonfarm payrolls were up by more than 2.7 million jobs from a year ago and the
jobless rate was down to 4.1 percent, the lowest level in 30 years. Even though the labor market is
getting increasingly tighter, there is no evidence of acceleration in wage costs.

As oil prices soared to more than $25 per barrel by early December from about $12 per barrel
a year ago, the inflation rate moved up to 2.6 percent in November from a year ago. However, the
core consumer price index — which excludes food and energy — was up only 2.1 percent, which is down
from 2.4 percent in 1998 and close to the lowest rate in more than three decades.

Long-term rates, after falling to the early 1967 levels in 1998, moved up more than a full
percentage point to 6.2 percent in early December.
financial_table1_774


World Economy Improving

The world economy is improving with
the U.S. economy leading the way.

Asia has overcome many of the problems that led to the 1997 crisis and continues to gain
strength, while Europe is getting healthier. Latin America, excluding Mexico and Peru, has major
economic problems.

The NAFTA region, led by the United States, has remained strong in the recent financial
crisis. The United States has absorbed most of the rest of the world’s exports. Its trade deficit
in current dollars shot up to more than $250 billion last year from just $89 billion before the
Asian crisis.

Oil prices, after plunging to an average of $12.6 a barrel in 1998 from $18.8 a barrel in
1997, shot up to over $25 per barrel by November of last year.
financial_table2_775


U.S. Growth Strong


Even though overall U.S. growth was
strong in 1999, manufacturing grew modestly.

The overall factory operating rate, at 80.7 percent in November was down from 81.3 percent a
year ago. Manufacturing payrolls were slashed by more than a quarter million jobs in 1999.

Net exports of goods and services deteriorated by an estimated $104 billion in nominal
dollars and by $106 billion in real terms as growth of U.S. imports outpaced exports by more than a
3-to-1 ratio.

With inflation low in Western Europe — less than 1 percent in France and Germany, and below
2 percent for most other countries — and overall growth down to 1.9 percent in 1999 from 2.7
percent in 1998, the policy emphasis has shifted toward stimulating economic activity by employing
a more expansive fiscal policy.

With interest rates up, sharply higher oil prices and tight labor markets, the question is:
what will be their impact on the U.S. economy?

Despite all the concerns and signs of some slowing, expansion will remain on firm ground.

In January of this year, the current economic expansion will overtake the expansion of the
1960s and become the longest ever for the U.S. economy.


Growth And More Growth


The latest consensus forecast calls
for a 3.2-percent growth in U.S. economic activity in 2000, according to both the quarterly survey
of economic outlook by the National Association for Business Economics and the Federal Reserve Bank
survey of Professional Forecasters (3.1 percent).

Looking ahead, our econometric model of the U.S. economy forecasts that real GDP will rise
3.7 percent this year, following gains of 4.0 percent in 1999, 4.3 percent in 1998 and 4.5 percent
in 1997. Gains in consumer spending, business investment in equipment, and a rebound in exports
will power growth. Interest rates are likely to rise from current levels.

Job creation is expected to decelerate but remain strong enough to push the jobless rate
further down. Inflation will continue to be under control assuming there are no further increases
in oil prices beyond $25 per barrel.

Here are the main reasons for our positive outlook. The rebound in economic activity in Asia
raised demand for petroleum, which, combined with production cutbacks by the major oil-producing
countries, boosted oil prices to more than $25 per barrel last November.

The expected removal of the sanctions on Iraq’s oil production means that OPEC members will
either have to raise production quotas or lower their allotment to make room for Iraq’s additional
output. This means that oil prices are likely to come under pressure reversing their recent upward
trend.

Oil prices should drop from current levels to around $20 per barrel. This means that the
impact of higher energy prices on inflation would narrow and overall inflation would continue to be
under control leaving plenty of room for the Federal Reserve to wait before raising short-term
interest rates to keep the expansion going.


Low U.S. Employment


Since the unemployment rate for most
European countries is still at or near double-digit levels and inflation is below 2.0 percent,
expansionary fiscal policy in 2000 would lead to an improvement in Europe’s economic activity but
not higher inflation.

With the U.S. population growing by 1.0 percent a year and the labor force participation
rate rising by another 0.6 percent, the labor supply gain is capped at 1.6 percent a year. With the
economy adding 0.2 million jobs a month in 2000, the unemployment rate will continue to be low and
is likely to drop below 4.0 percent in 2000.

While there has been some pick-up in wage growth and employers have difficulty finding
qualified workers, the 4.6-percent rise in compensation from a year ago is in line with
productivity gains and current inflation. Faced with an increasingly tight labor market, companies
have stepped up capital spending to become more efficient to preserve profit margins. This is
evident in productivity gains. Many companies have added flexibility to labor costs by adopting
policies in which part of the compensation is tied to profitability.

Finally, in a low-inflation environment and excess capacity, the need for consolidation is
likely to accelerate this year. We estimate that as long as companies stay on course with increased
capital spending and tying compensation to profitability, a drop in the jobless rate below 4.0
percent is not going to result in an acceleration of labor costs. Wage rate increases will follow
inflation and productivity gains.


financialtable3_780


Inflation And Productivity


Global competition, new technologies
and excess capacity around the globe have changed the dynamics of inflation and productivity. This
leaves little room for U.S. producers to raise their domestic or export prices. Thus, the focus
will be on increasing productivity to remain competitive and maintain profitability. This in turn
will intensify competition.

With the inflation rate at 2.2 percent last year and below 3.0 percent for the seventh year
in a row, wage increases tied to labor contracts will be modest.

Assuming no major surprise, food prices will be well behaved this year and are expected to
move up not more than the overall inflation rate. The only wild card is energy prices. While the
average acquisition price of oil is expected to be up 33 percent from $17.1 per barrel in 1999, oil
prices are seen coming down from current levels.

Thus, low inflation and a low unemployment rate will continue to coexist for another year.
Year-over-year inflation is seen rising by 2.5 percent in 2000, up from 2.2 percent in 1999 and the
three-decade low of 1.6 percent in 1998 brought about by the collapse of oil prices in the
aftermath of Asian crisis.


financial_table4_776


Foreign Exchange Markets


The effect of a pickup in U.S.
exports growth and a gradual decline of the value of the dollar in foreign exchange markets on
profits from foreign operations will be positive. Furthermore, with the overall industrial
operating rate moving up to 81.5 percent from 80.6 percent in 1999, capital spending on plant and
equipment in manufacturing will improve a bit. However, the big boost in capital spending on
equipment in the last four years came from investment in information and telecommunications-related
equipment. This trend is expected to continue in 2000.

The absence of capital spending related to the Y2K replacement of information-related
equipment is not likely to result in a precipitous drop in investment, as capital outlays on new
technologies will make up the difference.

Despite higher interest rates, the creation of new jobs will be enough to stimulate further
investment in structures. Real nonresidential investment is seen growing 9.1 percent following
gains of 9.2 percent in 1999, 12.7 percent in 1998 and 10.7 percent in 1997.


financial_table5_777


Strong Job Market


As the nation’s output of goods and
services expands by 3.7 percent, new hiring will be required. Furthermore, with U.S. exports on the
rise, employment losses in manufacturing will be less of a drain on employment growth. Nonfarm
payrolls are expected to increase by 2.4 million over the course of 2000.

In 1999, payrolls grew by more than an estimated 2.7 million jobs. Low inflation together
with growing employment and incomes and gains in stock prices will keep consumer spending strong.

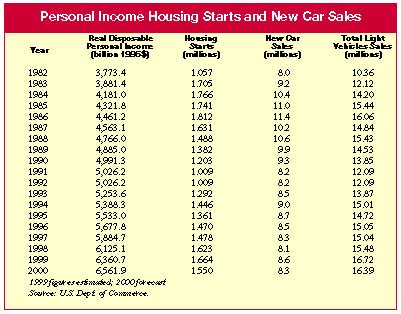
With short-term rates up by more than three-quarters of a percentage point, total sales of
new light vehicles are expected ease a bit to 16.4 million units this year from of 16.7 million in
1999.

This will be the fifth year in a row with total unit sales above 15 million and the second
consecutive year above 16 million. Also, the impact of higher mortgage rates on new home
construction will be mitigated by rising employment and increases in the stock market prices.

New construction will edge down to 1.55 million from 1.66 million in 1999.

Consequently, growth of consumer spending on durable goods adjusted for inflation is
expected to grow 5.0 percent this year after rising at double-digit rates of 10.9 percent in 1999
and 11.3 percent in 1998.

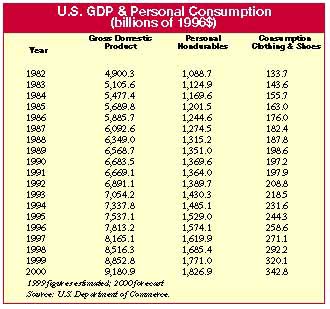
Demand for non-durable goods rose 5.1 percent last year from 4.0 percent in 1998. Purchases
of clothing were up 9.6 percent in real terms, following a 7.8 percent gain in 1998.

With consumer confidence running high, healthy growth in employment and incomes, low prices
bode well for spending on new clothing. Expect purchases of clothing and shoes to grow by 7.1
percent in real terms. All in all, consumer spending will move up 3.8 percent in 2000, after
soaring 5.1 percent last year.

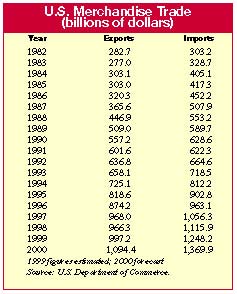
The trade deficit deteriorated rapidly last year, as our economy grew at a fast clip and
economic activity overseas was mediocre. Total U.S. exports in nominal terms averaged just 2.9
percent above the 1998 level, while they grew 3.6 percent in real terms, up from 2.2 percent in
1998, but sharply down from the trend growth of 10 percent in 1994-1997. Meanwhile, imports
continued to be a sore point for the United States even after factoring out the impact of the sharp
rise in oil prices. Strong domestic demand and a 3.7-percent decline of the dollar’s value against
most currencies in the world combined to push imports up 11.6 percent in real terms in 1999. In
current dollars, the merchandise trade deficit ballooned to an estimated $350 billion from $249
billion in 1998, while the surplus on services narrowed by $2.5 billion to $96.8 billion.

The appreciation from low values of the currencies in countries in Southeast Asia coupled
with strong economic activity will help U.S. exports to gain momentum this year. U.S. exports in
real terms, led by capital goods, are expected to grow 7.4 percent in 2000.

Conversely, our growth in imports is expected to slow down as U.S. economic activity
decelerates from 1999’s booming rate. The end result, however, would be a further deterioration in
net exports of goods and services in real terms. On the bright side, the trade slippage is expected
to narrow to $51 billion, down sharply from an estimated $106 billion in 1999. Nevertheless, this
will extend the period of rapidly rising merchandise deficits to nine years in a row.

The federal government surplus is expected to climb to $145 billion in the fiscal year 2000,
from $123 billion in 1999 and $69 billion in 1998. With surpluses for three years in a row after
running large deficits in nearly three decades, federal government spending adjusted for inflation
is expected to post a modest gain in 2000. This will be the second year in a row that government
spending grows, reversing real spending declines for eight consecutive years. Furthermore, with the
school age population rising, spending by local and state government is seen growing by 3.6 percent
in real terms.


financial_table6_778


Textiles Seeks Its Share


Prospects for U.S. producers of
fibers, textiles and apparel are not very promising for 2000.

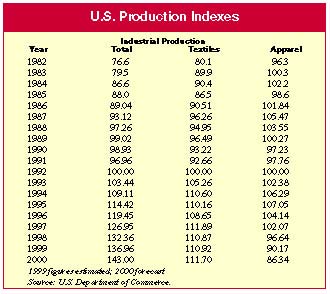
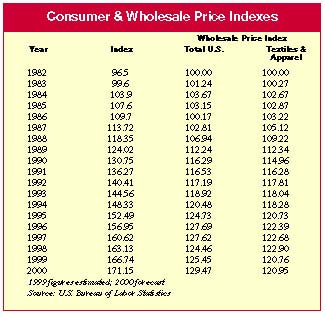
Clothing prices except for 1997 have been on a downtrend since 1992 falling by 1.4 percent
per year. The sharp appreciation of the dollar versus the currencies of countries with large
apparel exports to the United States in the aftermath of the Asian crisis in 1997 has accelerated
the decline in clothing prices to 2.0 percent in the last two years. This in turn has contributed
in part to the strong demand for clothing in real terms.

In 2000, with employment and income on the rise, clothing sales will do well. Total outlays
for clothing and shoes are expected to grow 7.1 percent in volume and 5.7 percent in dollar terms.
Last year, spending on clothing and shoes surged 9.6 percent in volume and 7.4 percent in dollar
terms. Unfortunately, the trade deficit for apparel rose to an estimated $48.3 billion in 1999 from
$45.2 billion in 1998 and $40.0 billion in 1997. All the benefits of increased domestic demand for
apparel, however, accrued to foreign producers because output of apparel declined 6.7 percent last
year on top a loss of 5.3 percent in 1998.

Housing starts are projected to remain above the 1.5 million mark for the third year in a
row hovering around 1.55 million units in 2000, but down from 1.66 million in 1999 and 1.62 million
in 1998. Since it takes six to nine months for the competition of homes, last year’s increase in
housing starts means that the number of owners of newly built homes will be virtually flat in 2000.
With personal income on the rise, sales of home furnishings are expected to increase. Sales of
existing homes, after reaching a historical high of 5.17 million units last year, are expected to
ease to 4.85 million. This will be the fifth year in a row that sales remained above the
4.0-million mark This high level of turnover in existing homes is a positive factor for sales of
textile home furnishings and other interior furnishings due to remodeling and redecoration. Bed and
bath wares will participate in kind.

Since U.S. industrial output is expected to strengthen this year, industrial fibers and
textiles will end up in the plus column. Moreover, the creation of more than 2.7 million jobs in
1999 reduced the vacancy rate. The addition of 2.4 million new jobs in 2000 bodes well for
additional demand for office space and a small improvement in new construction. In 2000, investment
in nonresidential buildings is expected to grow by about 2.0 percent in real terms, after remaining
flat in 1999 and rising by 5.3 percent in 1998. With after tax corporate profits still up by 8.5
percent in 2000, growth in business spending on carpeting and furnishings will benefit.


Demand for U.S.-made fibers, textiles
and apparel will see a small improvement in 2000. Exports will make a minor contribution to growth
as economic activity overseas improves, while imports will continue to gain ground resulting in
further deterioration in the trade gap.

Despite a gain in economic activity, production of domestic apparel and products is expected
to decline in 2000 for the fifth year in a row. In 1999, output was down an estimated 6.7 percent,
after falling 5.3 percent in 1998. This is more than twice the decline of 2.3 percent in the prior
two years and an indication of the effects of the currency devaluation in the aftermath of the
Asian crisis. This means that U.S. apparel production deterioration is likely to persist in 2000.
Textile production is expected to increase 0.7 percent this year, after being flat in 1999 and
coming down 0.9 percent in 1998.

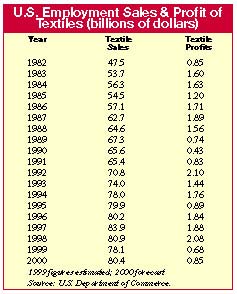
Shipments by textile producers are expected to move up to $79.4 billion from an estimated
$78.0 billion in 1999 and $80.9 billion in 1998.

In a low inflation period and still a strong dollar, wholesale textile and apparel prices
are likely to remain essentially flat after coming down 1.7 percent in 1999. The outlook for the
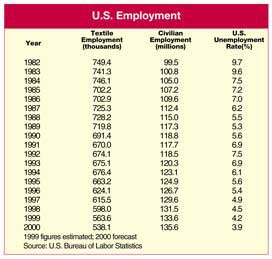
industry’s payrolls is for a 4.5-percent drop, down for the sixth year in a row. Last year,
payrolls declined 5.8 percent and have declined by 112,800 jobs since 1994. Expect employment to
average 538 thousand jobs in 2000, down more than fifteen thousand jobs from last year. Finally,
hourly wages will rise 3.0 percent in 2000.

In a cutthroat environment the industry must continue to invest heavily in replacing
noncompetitive capacity and in increasing efficiency in order to defend domestic markets from
rising foreign competition. In 1999, growth for textile exports slowed down to a meager gain of
$0.2 billion, while for imports rose by $0.7 billion, lifting the textiles net trade deficit for
1999 to $4.4 billion from $3.9 billion in 1998 and only $3.0 billion in 1997. Clearly, the sharp
appreciation of the dollar in the aftermath of the Asian crisis is part of the blame. While the
industry is to a large extent insulated from foreign competition due to its capital intensity, the
trade deterioration in the last three years is not likely to go away in the near future.

Moreover, in a low-inflation environment and squeezed profit margins rationalization is
unavoidable. With the industry’s operating rate expected to improve slightly to 84.7 percent from
84.3 percent in 1999 and 84.4 percent in 1998, this year’s textile spending on plant and equipment
will remain essentially at last year’s level.


Made In The U.S.A.


Demand for U.S.-made fibers, textiles
and apparel will see a small improvement in 2000. Exports will make a minor contribution to growth
as economic activity overseas improves, while imports will continue to gain ground resulting in
further deterioration in the trade gap.

Despite a gain in economic activity, production of domestic apparel and products is expected
to decline in 2000 for the fifth year in a row. In 1999, output was down an estimated 6.7 percent,
after falling 5.3 percent in 1998. This is more than twice the decline of 2.3 percent in the prior
two years and an indication of the effects of the currency devaluation in the aftermath of the
Asian crisis. This means that U.S. apparel production deterioration is likely to persist in 2000.
Textile production is expected to increase 0.7 percent this year, after being flat in 1999 and
coming down 0.9 percent in 1998.

Shipments by textile producers are expected to move up to $79.4 billion from an estimated
$78.0 billion in 1999 and $80.9 billion in 1998.

In a low inflation period and still a strong dollar, wholesale textile and apparel prices
are likely to remain essentially flat after coming down 1.7 percent in 1999. The outlook for the
industry’s payrolls is for a 4.5-percent drop, down for the sixth year in a row. Last year,
payrolls declined 5.8 percent and have declined by 112,800 jobs since 1994. Expect employment to
average 538 thousand jobs in 2000, down more than fifteen thousand jobs from last year. Finally,
hourly wages will rise 3.0 percent in 2000.

In a cutthroat environment the industry must continue to invest heavily in replacing
noncompetitive capacity and in increasing efficiency in order to defend domestic markets from
rising foreign competition. In 1999, growth for textile exports slowed down to a meager gain of
$0.2 billion, while for imports rose by $0.7 billion, lifting the textiles net trade deficit for
1999 to $4.4 billion from $3.9 billion in 1998 and only $3.0 billion in 1997. Clearly, the sharp
appreciation of the dollar in the aftermath of the Asian crisis is part of the blame. While the
industry is to a large extent insulated from foreign competition due to its capital intensity, the
trade deterioration in the last three years is not likely to go away in the near future.

Moreover, in a low-inflation environment and squeezed profit margins rationalization is
unavoidable. With the industry’s operating rate expected to improve slightly to 84.7 percent from
84.3 percent in 1999 and 84.4 percent in 1998, this year’s textile spending on plant and equipment
will remain essentially at last year’s level.


financial_table7_779


Risks To The Forecast


A major risk to our economic outlook
is the uncertainty stemming from the possibility of higher oil prices and inflation, which in turn
would translate into higher interest rates.

While an increase in oil prices will benefit the economies of the oil-producing countries,
it poses a threat to the recovery of the Asian economies and it would prolong the economic problems
in the region and deal another blow to U.S. exports. In this case, even though the risk of a
recession is low, economic growth will be in the 2.8-percent to 3.2-percent range in 2000.

On the bright side, if oil prices subside and fall below the $20 per barrel mark there will
be no need for Federal Reserve to raise rate any more. In this case, the U.S. economy is likely to
grow by at least 4.0 percent.


January 2000


Dystar Speeds Up Dye Selection WIth Data Base

Dystar, Germany, has announced that
it has created a way for textile finishers to be able to access all relevant data on the company’s
reactive dyes through a user-friendly data base. The system is planned for introduction for the
start of 2000.

This data base correlates with DyStar’s recent restructuring of its entire range of reactive
dyes.

Dyes can be selected on the data base through a variety of categories through the use of a
search function.


January 2000

Victor Woolen Products Purchases Frostman

Victor Woolen Products Ltd., New
York, has announced that it has purchased the core assets of Forstmann & Co. Inc. including two
manufacturing facilities and equipment in Dublin, Ga., and the company’s accounts receivable,
inventory, trademarks and other related assets.

Terms of the sale were not disclosed. The new company, Victor Forstmann Inc., will operate
as a wholly owned subsidiary of Victor Woolen Products.

“The tools are in place for us to carry our business forward and to be a force in this
market for a long time,” said Neal Grover, president, Forstmann.


January 2000

Understanding The Euro


europe_624T

he euro is the new currency that fuels economic growth by making it as easy to do
business across Europe’s national borders as it is across the United States. Thus, it provides a
sales and marketing tool the likes of which has never been seen before, whether selling, buying or
investing.

To understand the euro you must know some basics about its history, how it works and why.
Armed with this knowledge it will be easy for your company to take advantage of it in Europe.
Dealing in euros as the medium of exchange makes doing business easier and convenient because the
euro places you in a fair, if not favorable competitive position against your U.S. and foreign
competitors.


What Is The Euro?

The euro arrived January 1, 1999. To
date, 11 of the 15 European Union (EU) countries have joined the European Monetary Union (EMU).

Switzerland, who is not an EU member, is adopting the euro as its second currency. Cuba has
switched from a dollar-denominated economy to a euro-denominated economy. These acts provide
optimism for the euro’s future.

In Cuba’s case, however, the reason is unusual. Since the U.S. embargo, much of the business
Cuba did with the United States shifted to Europe, so it makes sense for Cuba to be euro
denominated.

EMU members may use their national currencies as well as the euro, but all bank transactions
are exchanged to or from euros. But on December 31, 2002, national currencies will be consigned to
history and the euro will be the only medium of exchange for all EMU members.

Bank’s foreign currency operating expenses will be cut about 90 percent in 2002, and for
companies who deal in EMU currencies, they can reap all the benefits now.


How The Euro Works

Until 1999, hidden in the exchange
rate and fees were premiums of 3 to 8 percent. However, by 2003 there will be one conversion fee in
the EMU.

The euro works because each of its members’ currency exchange rates are fixed permanently to
the currencies of all the other members. Even though the EMU comprises 11 of the 15 EU nations
fixed currency values are the mechanism that allows the euro to be traded across EMU borders with
no change in value. Therefore, there is a zero exchange rate risk when dealing across EMU
borders.


EMU Membership

In 1998 the EU took certain steps so
that the Czech Republic, Hungary and Poland might be accepted into the Union within a few years.

In 1999, the EMU enacted a capped annual budget of $92 billian through 2006. Therefore, if
any or all of these states are admitted to the EU knowing their EMU membership costs in advance
helps them prepare to meet the EMU criteria.

In early 1998, both Denmark’s and Sweden’s publics, by small margins, voted against joining
the EMU. But a 9.5-mile tunnel, overland rail and vehicle bridge which connects the two markets was
almost finished. Sweden, whose economy is much larger than Denmark’s, would, for the first time,
have easy access to Europe’s mainland and its markets. Today the majority of voters in both
countries appear to have swung in favor of the EMU, and the consensus is that they will join the
EMU by 2003 latest.

In spring 1999, England announced it would probably join the EMUby 2002 (after their
national elections).

By September 1999, British Foreign Secretary Robin Cook, addressing a group of executives in
Tokyo, said that the euro is already bringing new strength to EMU’s economies and lauded the euro
as a positive economic force. Normally, nobody would pay much attention to Cook’s remarks but the
euro has become a political issue between the Labor and Conservative Parties. Part of the problem
is that interest rates in England are about double those in the EMU.

A few English towns are experimenting with the use of the euro, and it is now believed that
the consuming public has come around to believing that the euro will be a good thing for England.
Most internationalists believe that England has little choice and must join the EMU to remain
competitive.

On September 5, 1999, Greece, which has been working hard to meet the criteria, announced it
would apply for EMU membership in March 2000, for EMU approval in June. Greece’s inflation rate for
July was 2.1 percent and its annualized inflation rate might be low enough by this March. There are
internal political issues that might come into play which could cause Greece to withdraw its
application for EMU membership.

euro_773


The Long Road

To appreciate how difficult and long
the road to Euroland was we must go back to 1946. Winston Churchill, England’s famous Prime
Minister, envisioned a United States of Europe as it began recovering from the devastation of World
War II.

Together with a few of Europe’s leaders, he realized that each country’s economy could not
sustain itself independently against each other’s, nor could they stand up to the economic might of
the United States. Churchill’s dream crawled and clawed its way to become the 15-nation EU which
conceived, implemented and established the euro.

In the late 1940s, Belgium, the Netherlands and Luxemburg formed the first European Common
Market. As a result of the Treaty of Rome (1957), France and Italy joined and the “Benelux” became
the “Common Market.” As its membership grew, the name changed to the European Economic Community
(EEC).

The euro, even though four EU countries have yet to join the EMU, is backed by the 15 EU
currencies. (Many continue to refer to the euro as the euro dollar. The euro is the euro and the
euro dollar is something different.)

In 1986, the EU took a gigantic step and agreed that all member nations would be internally
duty free by 1993. This act gave the European textile industry a boost by broadening its markets on
the continent.

In 1991, the Maastricht (Holland) Treaty formed the European Monetary Union and the European
Central Bank (ECB) over which political leaders have no say.

Further, it provides that one currency must be implemented by January 1, 1999 for EU members
who meet EMU membership criteria.

In 1995, the first try failed, but the Treaty of Cannes put a new plan together. Every
detail of the EMU had to be approved by all not later than May 1998.


Modern Miracle

Imagine the more than 2,000 matters
the myriad of sub-committees had to deal with and have ratified so the euro could arrive on time.
It boggles the mind to think of 15 independent national legislatures, with their internal politics
and national pride, could achieve unanimity and that 11 nations would opt to join the EMU.

The Maastricht Treaty, which put
teeth into the EMU, was worked out by Europe’s industrial powerhouses — Germany, France, Italy and
England — without consulting any of their other EU partners. Yet eight more nations joined while
England did not.

The ECB operates with complete independence and every EMU member’s central bank relinquished
its powers to control ECB policies even though ECB decisions might directly affect their nation’s
economies. In effect, national central banks, which act like the Federal Reserve Bank, made
themselves subservient to the ECB, which establishes interest rates, protects currency, etc.

Every rule and act relating to the EMU had to be unanimously ratified by all 15 EU members
by May 1998.

The euro arrived on January 1, 1999 and though the permanent exchange rates equaled a value
of 1.00 = $1.05 it opened at $1.17 and fluctuated between $1.14 and $1.18 for a few weeks.
Afterwards, it fluctuated between $1.04 and $1.09 through October 1999. There were a few days when
it dipped to about $1.02.

Though the euro’s performance has been less than what had been expected, optimism about the
future of the euro as the powerhouse that drives business has not waned.

There is little room for doubt that the euro is a sales and profit driver, something U.S.
textile companies sorely need.


EMU Requirements


1) A nation’s budget deficit may not
exceed 3 percent* of Gross Domestic Product (GDP).

2) As of January 1, 1999, inflation cannot exceed 2.7 percent*. The formula that determines
the rate follows: the inflation rate for any member may not be more than 1.5-percent higher than
the average inflation rate of the three member countries with the lowest rates of inflation.

3) Long-term interest rates may not exceed 7.8 percent*. Formula: Long-term interest rates
may not exceed 2 percent of the average inflation rate of the three member nations with the lowest
inflation rates.

4) Total outstanding government debt must not exceed 60 percent* of GDP or working towards
this target.

5) A member nation’s currency should have remained within normal fluctuation margins for at
least two years before the decision is made to join the EMU. This is an over simplification of a
highly complex matter.

*based on 1997 performance — Rates may change annually.


January 2000

Meeting The Challenge


mexpuzzle_627O

nce again, the push for CBI parity has failed in the U.S. Congress. As a result,
Caribbean Basin countries will have to wait longer for increased access to the U.S. market.

For many U.S. manufacturers and importers, they will have to wait for better access to the
quality manufacturers of the Caribbean. But, for Mexican textile and apparel manufacturers, the
delay is probably a good thing, as Mexico will continue to enjoy a significant advantage over the
Caribbean through NAFTA and will have more time to further solidify its position as the major
competitor for Caribbean Basin countries.

Under NAFTA the Mexican textile and apparel industry has blossomed. Exports to the United
States have skyrocketed in recent years. Also, new investment in Mexico is now at an all-time high,
with investors flocking from the United States and other countries as well.

With such explosive growth, Mexico has much to fear from a successful implementation of NAFTA
parity for the Caribbean. Whereas Caribbean nations now face clothing quotas, Mexico faces few.
Mexican exporters enjoy low or zero-percent U.S. import duties for many products, and CBI faces
normal MFN tariff rates. Additionally, Mexico maintains a growing textile industry in support of
its apparel capacity further enhancing Mexican competitiveness. The Caribbean, in turn, does not
have much of a knitting or weaving industry.

Under the proposed versions of NAFTA parity for the Caribbean, these advantages would go away
as the Caribbean would enjoy NAFTA-style tariff and quota benefits. Further, special provisions of
the proposed NAFTA parity legislation will go a long way to helping certain Central American
countries to develop a more vigorous textile industry in support if their already aggressive
apparel industry.

For American apparel companies, the stakes are high, as many firms see the preferential
provisions of NAFTA with Mexico, coupled with such provisions for the Caribbean, as the only
effective way to compete in today’s world markets. As domestic apparel manufacturing has become
more and more expensive, outward processed (“807”) and full-package production in Mexico and the
Caribbean using U.S. piece goods are some of the only viable manufacturing options left — short of
abandoning manufacturing all together and sourcing everything from the Far East.


The Mexican Apparel Industry


weaver_629

The apparel industry in Mexico represents one of the largest manufacturing sectors in the
Mexican economy. Employing nearly 460,000 workers, Mexican apparel industry employment has more
than doubled since 1993. It is estimated that Mexico’s apparel industry produced nearly $8.5
billion of product in 1998, up from just $3.6 billion in 1993.

There are currently more than 22,000 apparel companies in Mexico, with the average company
employing just about 40 workers and with many companies employing less than 5 workers. So-called
large firms (with more than 500 workers) account for less than 2 percent of all apparel companies
in Mexico.

Because there are so many small manufacturers in Mexico, these companies tend to be easily
buffeted by market trends, as they do not typically have the financial resources to ride out stormy
periods in the Mexican economy.

Although many of the firms operating in Mexico originally acted as Macquiladoras (that is,
they acted as assemblers of U.S. components) they have moved their production more and more into
the full-package arena. It has been easier for these companies to do so as they have received
better training and investment for United States and other apparel importing companies.

As the quality and price of the garments produced in Mexico has improved, the traditional
Macquiladora assembling activity has dropped. In fact, “807” type exports to the United States has
fallen from an equivalent of nearly 93 percent of all Mexican apparel exports in just 1993 to only
about 80 percent in 1998. In 1999, this percentage has fallen even more. At the same time, total
U.S. apparel imports from Mexico has soared from $1.3 billion in 1993 to more than $6.7 billion in
1998. The United States is the largest export market for Mexico by far with more than 90 percent of
all Mexican apparel exports going to the United States in 1997.

For many products, 1999 was the first year for zero duty status under the NAFTA agreement.
Under the “807” duty structure, duty is only paid on the value added in Mexico; thus it made
economic sense to use U.S. cut pieces for apparel assembly in Mexico. Now under NAFTA, however,
U.S. import duties have gone to zero for many key products, thus changing the economics so that it
makes much more sense to produce full-package garments in Mexico and forgo the U.S. cutting step
required under the “807” provisions.


The Mexican Textile Industry

Several large mills dominate Mexico’s
textile industry, but there are a variety of smaller manufacturers that fill specific niches in the
Mexican market. For years, Mexico’s textile industry was largely sheltered from the challenges of
global trade thanks to a high import tariff structure enforced by the Mexican government. As key
supporters of the traditional closed Mexican political system, textile interests were able to all
but close down their domestic market to foreign competitors.

The largest mills are almost exclusively family owned. Although in general these firms are
not of the scale of the largest U.S. mills, they do control significant portions of the Mexican
market. The financial strength of these firms varies and the impact of the relatively recent peso
crash and ensuing currency debacle cannot be understated. Because of the shaky financial status of
many of these firms leading out of the peso disaster, many of these firms looked to partner with
stronger, larger U.S. mills. Many U.S. firms, in turn, looking to better supply U.S. apparel
companies that had moved into Mexico after the signing of NAFTA, welcomed the new
partnerships.

meeting1_782


Investment Opportunities

There have been several
well-publicized investments in Mexico. These include new investments/joint ventures of Burlington
Industries, Cone Mills
(See “Success Through Partnership” in this issue.), Guilford Mills, Kosa and DuPont. As of
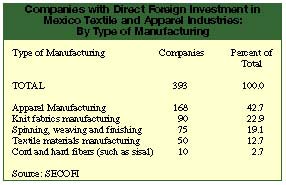
1996, 393 companies were registered with the Mexican government as having direct foreign investment
related to the textile sector. This represents about 3 percent of all firms with foreign capital in
Mexico (about 13,000 firms in total).

Based on their primary manufacturing activity, as reported to the Mexican government, about
43 percent are classified as apparel manufacturers; 23 percent as double-knit fabric manufacturers;
19 percent spin, weave and finish fibers; 13 percent manufacture textile materials and about 3
percent in the hard fiber textile industry.

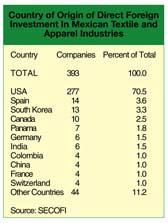
As for the origin of foreign investment in textile manufacturers, more than 70 percent of
them have U.S. capital; nearly 4 percent have Spanish investment; 3 percent Korean; 2.5 percent
Canadian; and over 20 percent from other countries. More than a quarter of these firms are located
in the Mexico City area. Between 1994 and 1996 (the most recent years reported), more than $340
million of foreign capital was invested in Mexico’s textile sector. This equates to about 2 percent
of all foreign capital invested in Mexico during the same period (about $16.5 billion).

Of the foreign capital invested in Mexico’s textile industry, more than $133 million were
invested in spinning, weaving and finishing operations (39 percent of total textile and apparel
sector); about $89 million were invested in knit fabric manufacturing (26 percent of total); more
than $83 million were invested in apparel manufacturing (about 24 percent of total); and more than
$36 million were invested other textile-related activities (almost 11 percent of total).

meeting2_781


A Transitional Mechanism


dancers_626While
the export and production growth of Mexico’s textile and apparel industries has been stunning in
recent years, much of this growth is directly attributable to the duty benefits of the NAFTA
agreement, along with the shorter delivery times afforded to Mexican manufacturers due to the close
geographic proximity to the U.S. market.

However, the benefits of NAFTA may prove to be fleeting at best for U.S. apparel companies
now sourcing product in Mexico, as any CBI parity legislation will force a more even playing field
with the Caribbean and the WTO quota phase-out of the Multifiber Arrangement will make it much
easier for Far Eastern firms to gain entry to the U.S. market. Further, MFN import tariffs have
been cut under the terms of the WTO agreement. All of this not only represents a significant
reality for U.S. companies new to the import sourcing game, but also represents a profound threat
to the long-term prospects of Mexico’s apparel industry. In particular, “807” production will be
under increasing pressure to compete.

Although agreements such as NAFTA and CBI Parity have and will help certain U.S. and
regional firms to be more competitive, these agreements should perhaps be viewed as being
transitional, designed to assist U.S. manufacturers to ease their way offshore. NAFTA in particular
should be viewed as a means to end — not a final solution for America’s textile and clothing
industries. In time, it is unlikely that NAFTA or the CBI legislation will be able to halt an
inevitable climb in imports from the Far East brought about be elimination of MFA quotas and
reduction of import tariffs under the WTO agreement.


Impact Of China


uxmal_628China
is lurking once again as a major competitor poised to dominate the U.S. market. Whereas exports
from China and other major suppliers in the Far East had fallen in recent years, this trend has
begun to reverse itself. At the same time, the recent U.S. offer to not resist China’s efforts to
enter the WTO and support of a shortened five-year elimination of MFA quotas, represents not only a
wholesale sellout of the domestic textile and clothing industries by the U.S. government, but a
potentially devastating blow to the Mexican textile and apparel industries and a threat to the
long-term viability of the NAFTA agreement.

In turn, these developments will translate into a significant challenge for the Caribbean
nations — with or without NAFTA parity.

Because of the five-year entry time for China’s quota-free access to the U.S. market (other
suppliers will have to wait for a total of 10 years), domestic manufacturers will be faced with
more competition than ever. Low prices will also be more important than ever. Once China is free
from import quotas, their industry will move quickly to more efficiently utilize the full capacity
of its massive textile and clothing industries.

The recent overcapacity problems that have plagued many sectors of the Chinese textile and
clothing complex will gradually cease to be a problem and exports will rise substantially. Export
gains will be further enhanced by the lower import tariff rates agreed to by the United States in
the WTO agreement. This will all translate into lower prices in the U.S. market.


The Bottom Line

It is possible that as China and
other Far Eastern suppliers make inroads into the U.S. market, many U.S. firms, which have already
invested heavily in Mexico, will be forced, for competitive reasons, to move their investments out
of Mexico in favor of other more competitive regional producers. In turn, the impact of a possible
Free Trade Agreement of the Americas may act as further incentive for U.S. firms to move even
farther and farther South away from Mexico.

The bureaucrats in Washington, Beijing and Geneva have, in some ways, sealed the fate of the
Mexican apparel industry. With China’s inevitable entry into the WTO, the Mexican apparel industry
will be hard pressed to compete in the U.S. market. At the same time, possible NAFTA parity for the
Caribbean will also represent a challenge. As a result, much of Mexico’s economic progress in
recent years may be undermined and substantially disrupted.

After the recent WTO ministerial meeting in Seattle, the question was asked by many: why are
they all sleepless in Seattle? Lost in the public display of anger over the role of the WTO in
world trade and the impact of multilateralism on the environment and traditional ways of life, such
as farming, was the fact that the U.S. textile and clothing industries have been dealt a severe
blow by being traded away in the name of global trade.

It is ironic that Mexico’s textile and apparel industries, which are so closely tied to U.S.
manufacturers, are now also in danger of being undermined by those very forces that fought so hard
to have NAFTA passed in the name of free trade in the first place.


January 2000

Quality Fabric Of The Month: New Fabric Makes Protective Garments More Parch Proof

Hydroweave™ is designed to harness the cooling power of evaporation. The new fabric is used in garments to lower the core body temperature. AquaTex Industries Inc. of Huntsville, Ala., developed the product.

The fabric can keep people working in temperatures from 90° to 360° cool for up to eight hours, according to the company. Tests conducted at Auburn University show that Hydroweave offers users superior heat protection.

The fabric sheds heat and regulates core body temperatures using evaporation. These benefits are especially important in industrial applications and other environments where personal protective equipment is worn.

“Humans give off 75 percent of our energy in heat,” said Dr. David Pascoe, a human bioenergetics expert and associate professor in the Department of Health and Human Performance at Auburn University.

“If personal protective equipment or other barriers prevent us from releasing that heat to the environment, we have to find another way to get rid of it before problems such as heat stress or heat stroke arise.”

The fabric’s temperature-regulating properties enable people to work up to 16.4 percent longer when wearing a vest made of Hydroweave under their standard-issue protective gear, according to encapsulated tests conducted by Dr. Pascoe. Hydroweave’s cooling properties stem from its unique design and water-absorbing fiber batting.

In the fabric’s patented three-layer composite design, the batting is sandwiched between an inner thermal conductive lining and a breathable outer shell.

Before use the fabric is soaked in tap water for five minutes. Excess water is then squeezed from the garment, and the inner lining is wiped dry.

During wear the microporous inner conductive lining pulls heat away from the wearer. Super-absorbent fibers in the batting store more water than conventional fabric and release the water in a controlled fashion over a longer period of time.

The water evaporates as it passes through the outer shell, cooling the user.

The gradual moisture release results in increased cooling and a longer-lasting cooling effect. Since the conductive waterproof lining separates the batting from the wearer, the garment feels cool, dry and comfortable.

Current Hydroweave users include The 3M Company, Sterling Environmental, the Glendale Police Bomb Squad, Synthetic Industries and the Medical Transportation Service of Fort Benning, Ga. The fabric is also being combined with DuPont’s fireproof Nomex® fiber for use in flame-retardant clothing.

Hydroweave also has sport applications. Several NFL and collegiate teams are using the product. Players for the Cleveland Browns, St. Louis Rams, Philadelphia Eagles and the University of Alabama’s Crimson Tide are wearing shoulder pads and helmet liners made of Hydroweave.

AquaTex Industries has also signed an agreement with LEAF Racewear & Safety Equipment to provide Hydroweave fabric to be used in a line of racing suits and inner liners for racing suits. The new suits are designed for oval, drag and road racing.


For more information on Hydroweave™ contact AquaTex Industries Inc. of Huntsville, Ala., (800)
366-7753.


January 2000

Sponsors