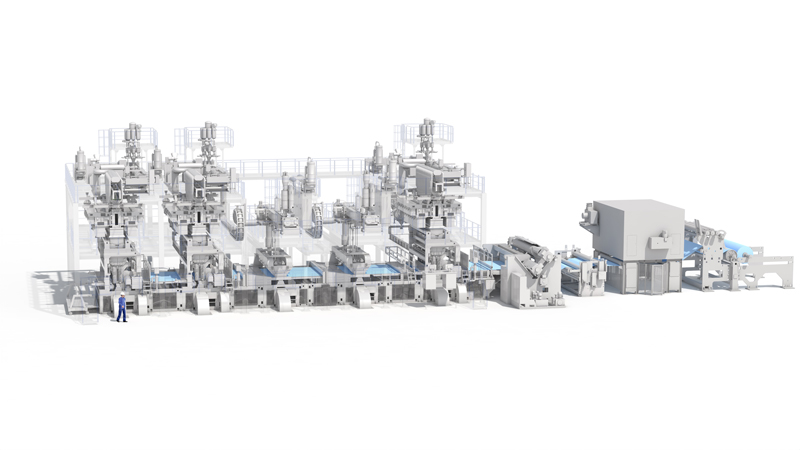
Creative Brands Acquires Bella il Fiore

PHOENIX — January 27, 2022 — Creative Brands of Phoenix, Ariz., has acquired the Bella il Fiore Company of Tulsa, Okla.

Bella il Fiore was founded in 2000 and is a family owned and operated company focused on providing exceptional sleep, spa and beauty textiles to the specialty gift, spa, and wellness markets.

For more than 20 years, Bella il Fiore has solidified its position as the market leader in pajamas, sleep masks, robes, spa raps and headbands along with beauty, face and skin accessories. What once started as a body care line with just five products has now flourished into a collection of over 200 products that are helping empower women to become the best version of themselves. Bella is proud to encourage every woman to create an affordable, spa-like experience at home. The Bella team has had huge success in leading a brand that encourages self-care with signature style, a good night’s sleep, and an elevated beauty routine.

“We are very pleased to have a new strategic partner who will share our vision for Bella and help us grow our business in the future. This team is well versed with the needs of our industry and can help strengthen our marketing position in women’s sleepwear products across all channels of distribution,” said Suzanne Maniss. “With their resources, and the help of their field sales force, telemarketing staff and sophisticated web presence, we firmly believe Bella il Fiore will continue to grow profitably and offer our customers the highest quality products and superior customer service that our industry has come to expect.”

Creative Brands, founded in 1948, is a distribution, importing and manufacturing firm with six distinct catalogs selling to an assortment of retailers across the country.

Recent acquisitions include Santa Barbara Design Studio, Slant Collections, 47th & Main, Stephan Baby, Heartfelt and Face Two Face Designs in the gift industry in addition to their Faithworks brand that distributes inspirational products to the Christian retail channel.

Paul DiGiovanni, president of Creative Brands, said, “We are thrilled to be a part of this wonderful Bella il Fiore brand. The Maniss family have combined vision and hard work to build this unique women’s gift and spa brand and we look forward to offering this exclusive grouping of quality products to our new combined customer base.”

Creative Brands is a wholly owned subsidiary of CBC Group headquartered in Phoenix, Ariz., with manufacturing facilities, a call center, and a distribution center in Lewisburg, Tenn.

Posted: February 1, 2022

Source: Creative Brands

Ocean State Innovations Announces Appointment Of Geoff Senko As Senior Vice President Of Sales

PORTSMOUTH, R.I. — February 1, 2022 — Ocean State Innovations (OSI), a textile provider, announced today the appointment of Geoff Senko as senior vice president of sales. Senko joins OSI with more than 10 years of textile experience. Most recently he held the position of National Account Manager for MMI Textiles and served on the Military Board of IFAI, the SEAMS Board, and was chair of the SEAMS Military Committee. Senko will be responsible for guiding sales strategy and efforts throughout North America and globally for OSI while supporting the overall success for customers in various market segments.

“I am excited to have Geoff join the team as we continue to be a force in the global textile industry. Geoff’s sales leadership and extensive expertise in the industry make him an ideal addition to our company,” said Edward Ricci, CEO and co-owner of OSI.

Ben Galpen, co-owner of OSI, added, “We pride ourselves in our textile solutions expertise, Geoff not only brings us further textile solutions but is customer relationship driven, a trait we welcome at OSI.”

Posted: February 1, 2022

Source: Praesidian Capital

Pendleton Gather Blanket By Emma Robbins Launches; Raises Funds For Digdeep’s Navajo Water Project

PORTLAND, Ore. — February 1, 2022 — Pendleton Woolen Mills, a lifestyle brand headquartered in Portland, Ore., introduces the new Pendleton Gather blanket designed by Emma Robbins: a Diné artist, activist, founder of The Chapter House, and the executive director of DigDeep’s Navajo Water Project. Pendleton will donate a portion of proceeds to the Navajo Water Project, which will support Robbins’ work to expand water access on the Navajo Nation, where more than 30 percent of residents are living without clean, running water in their homes.

Representative of a community that has persevered despite limited access to water, the Pendleton Gather blanket by Emma Robbins features symbols of endurance: a sáanii (maternal grandmother) scarf, crossed by traditional sash belts used in ceremonies and childbirth. At the center, a young woman’s bracelet of silver is set with turquoise, a stone formed by rare rains flowing through acrid layers of rock. In Navajo culture, turquoise is a sacred stone that symbolizes protection and reflects the different types of water needed for life and health.

“I cannot say enough positive things about working with the team at Pendleton,” Robbins said. “I typically work in mixed media and three dimensions and their team was collaborative every step of the way, ensuring my vision translated to the final product, telling a story of resilience and empowerment. The donation of proceeds will help us to continue our important work across the Navajo Nation.”

In addition to creating this blanket with Pendleton and her work as an artist, Robbins serves as the full-time executive director of the Navajo Water Project. Robbins, alongside her Indigenous-staffed team, has worked to install running water to homes on the Navajo Nation since 2015. Throughout the COVID-19 pandemic, they’ve expanded their work to deploy hundreds of additional portable water tanks to families and innovated their Home Water Systems to allow for contactless installation, so that families can stay home and stay safe during this time of crisis.

“We are honored to partner with Emma Robbins and DigDeep’s Navajo Water Project to create the Gather blanket,” said Pendleton CEO John Bishop. “Emma’s powerful use of color and soft shaped motifs has resulted in an expressive and symbolic blanket. We are also pleased to launch this new philanthropic partnership in support of Dig Deep’s crucial work across the Navajo Nation.”

Gather Pendleton blankets by Emma Robbins, benefitting DigDeep’s Navajo Water Project, are available beginning February 1, 2022 on Pendleton-USA.com, DigDeep.org/shop-gifts and other select retailers.

Posted: February 1, 2022

Source: Pendleton Woolen Mills

Manufacturing PMI® at 57.6 Percent; January 2022 Manufacturing ISM® Report On Business®

TEMPE, Ariz. — February 1, 2022 — Economic activity in the manufacturing sector grew in January, with the overall economy achieving a 20th consecutive month of growth, say the nation’s supply executives in the latest Manufacturing ISM® Report On Business®.

The report was issued today by Timothy R. Fiore, CPSM, C.P.M., Chair of the Institute for Supply Management® (ISM®) Manufacturing Business Survey Committee:

“The January Manufacturing PMI® registered 57.6 percent, a decrease of 1.2 percentage points from the seasonally adjusted December reading of 58.8 percent. This figure indicates expansion in the overall economy for the 20th month in a row after a contraction in April and May 2020. The New Orders Index registered 57.9 percent, down 3.1 percentage points compared to the seasonally adjusted December reading of 61 percent. The Production Index registered 57.8 percent, a decrease of 1.6 percentage points compared to the seasonally adjusted December reading of 59.4 percent. The Prices Index registered 76.1 percent, up 7.9 percentage points compared to the December figure of 68.2 percent. The Backlog of Orders Index registered 56.4 percent, 6.4 percentage points lower than the December reading of 62.8 percent. The Employment Index registered 54.5 percent, 0.6 percentage point higher compared to the seasonally adjusted December reading of 53.9 percent. The Supplier Deliveries Index registered 64.6 percent, down 0.3 percentage point from the December figure of 64.9 percent. The Inventories Index registered 53.2 percent, 1.4 percentage points lower than the seasonally adjusted December reading of 54.6 percent. The New Export Orders Index registered 53.7 percent, up 0.1 percentage point compared to the December reading of 53.6 percent. The Imports Index registered 55.1 percent, a 1.3-percentage point increase from the December reading of 53.8 percent.”

Fiore continued, “The U.S. manufacturing sector remains in a demand-driven, supply chain-constrained environment, but January was the third straight month with indications of improvements in labor resources and supplier delivery performance. Still, there were shortages of critical intermediate materials, difficulties in transporting products and lack of direct labor on factory floors due to the COVID-19 omicron variant. Quits rate and early retirements hinder reliable consumption. Panel sentiment remains strongly optimistic, with seven positive growth comments for every cautious comment, up from December’s ratio of 6-to-1. Demand expanded, with the (1) New Orders Index slowing but remaining in strong growth territory, supported by continued expansion of new export orders, (2) Customers’ Inventories Index remaining at a very low level and (3) Backlog of Orders Index slowing but settling at more normal growth levels. Consumption (measured by the Production and Employment indexes) grew during the period, though at a slower rate, with a combined negative 1-percentage point change to the Manufacturing PMI calculation. The Employment Index expanded for a fifth straight month, with signs that ability to hire continues to improve, though somewhat offset by continued challenges of turnover (quits and retirements) and resulting backfilling. Limited expansion strength in production in January, primarily due to absenteeism rates as a result of omicron, was the biggest reason PMI growth was held back. Inputs — expressed as supplier deliveries, inventories, and imports — continued to constrain production expansion, but there are clear indications of improved delivery performance. The Supplier Deliveries Index again slowed while the Inventories Index expanded, both at a slower rate. In January, the Prices Index increased for the 20th consecutive month, at a faster rate (an increase of 7.9 percentage points) compared to December, indicating that supplier pricing power continues to rise.

“All of the six biggest manufacturing industries — Machinery; Food, Beverage & Tobacco Products; Transportation Equipment; Computer & Electronic Products; Chemical Products; and Petroleum & Coal Products, in that order — registered moderate to strong growth in January.

“Manufacturing performed well for the 20th straight month, with demand and consumption registering month-over-month growth. Meeting demand remains a challenge, due to hiring difficulties and labor turnover at all tiers. For the third month in a row, Business Survey Committee panelists’ comments suggest month-over-month improvement on hiring, offset by backfilling required to address employee turnover at a higher rate, supplier performance and improvements in the transportation sector,” Fiore said.

The 14 manufacturing industries reporting growth in January — in the following order — are: Apparel, Leather & Allied Products; Furniture & Related Products; Miscellaneous Manufacturing; Nonmetallic Mineral Products; Machinery; Electrical Equipment, Appliances & Components; Food, Beverage & Tobacco Products; Transportation Equipment; Primary Metals; Fabricated Metal Products; Computer & Electronic Products; Chemical Products; Petroleum & Coal Products; and Plastics & Rubber Products. The only industry reporting a decrease in January compared to December is Paper Products.

What Respondents Are Saying

“We are experiencing massive interruptions to our production due to supplier COVID-19 problems limiting their manufacturing of key raw (materials) like steel cans and chemicals.” [Chemical Products]

“While there has been some improvement in materials making it to our factories and logistics centers, we are still constrained by (a lack of) qualified labor. Orders so far are not being cancelled, but we are concerned that customers may be losing patience.” [Computer & Electronic Products]

“Transportation, labor and inflation issues continue to hamper our supply chain and ability to service our customers. Fortunately, it’s also hampering our competition as well. Ultimately, the biggest impact is at the consumer level, as (price increases) continue to get passed through.” [Transportation Equipment]

“Our suppliers are having difficulty meeting scheduled releases as their suppliers experience delays and shortages, so lead times and inventories are struggling, resulting in lost production.” [Food, Beverage & Tobacco Products]

“Lack of skilled production personnel, either from missing work due to (COVID-19) variants or leaving for better opportunities, making it more difficult to complete work. Working off a backlog.” [Fabricated Metal Products]

“Strong backlog of orders coming into the new year. Potential to beat target revenue, depending on availability of purchased product.” [Electrical Equipment, Appliances & Components]

“Bookings continue to increase as we are still dealing with a shortage of labor and supply chain issues.” [Furniture & Related Products]

“Transportation restrictions and a lack of supplier manpower continue to create significant shortages that limit our production. This, in turn, limits what we can supply to customers, as well as on-time delivery.” [Machinery]

“Integrated circuit availability is really causing issues. Shortages of raw materials and other electronic materials continue to hamper deliveries to our customers.” [Miscellaneous Manufacturing]

“The supply chain crunch may be loosening a bit; however, specific original equipment manufacturer (OEM) parts and equipment now have lead times that we have not experienced before.” [Nonmetallic Mineral Products]

MANUFACTURING AT A GLANCE

January 2022

Index Series Index

Jan

Series Index

Dec

Percentage

Point

Change

Direction Rate of Change Trend* (Months)
Manufacturing PMI® 57.6 58.8 -1.2 Growing Slower 20
New Orders 57.9 61.0 -3.1 Growing Slower 20
Production 57.8 59.4 -1.6 Growing Slower 20
Employment 54.5 53.9 +0.6 Growing Faster 5
Supplier Deliveries 64.6 64.9 -0.3 Slowing Slower 71
Inventories 53.2 54.6 -1.4 Growing Slower 6
Customers’ Inventories 33.0 31.7 +1.3 Too Low Slower 64
Prices 76.1 68.2 +7.9 Increasing Faster 20
Backlog of Orders 56.4 62.8 -6.4 Growing Slower 19
New Export Orders 53.7 53.6 +0.1 Growing Faster 19
Imports 55.1 53.8 +1.3 Growing Faster 3
OVERALL ECONOMY Growing Slower 20
Manufacturing Sector Growing Slower 20

Manufacturing ISM® Report On Business® data is seasonally adjusted for the New Orders, Production, Employment and Inventories indexes.

*Number of months moving in current direction.

Indexes reflect newly released seasonal adjustment factors.

Commodities Reported Up/Down In Price And In Short Supply

Commodities Up in Price

Adhesives and Paint (2); Aluminum (20); Aluminum Products; Calcium Carbonate; Caustic; Copper; Corrugated Packaging (15); Crude Oil*; Diesel Fuel (13); Electrical Components (14); Electronic Assemblies; Electronic Components (14); Freight (15); Hydraulic Components; Labor — Temporary (9); Lubricants (2); Lumber (2); Lumber — Pallets; Natural Gas* (7); Ocean Freight (14); Packaging Film; Packaging Supplies (14); Paper Products; Plastic Resins; Resin Based Products (12); Ridged Plastic Packaging Products; Rubber Based Products (6); Semiconductors (12); Soy Based Products; Steel* (18); Steel — Hot Rolled*; Steel — Stainless (15); Steel Drums; Steel Products* (17); Vegetable Based Oils; and Zinc Compounds.

Commodities Down in Price

Crude Oil* (2); Natural Gas* (2); Plastic Resins; Steel* (3); Steel — Carbon; Steel — Hot Rolled* (3); Steel — Scrap; and Steel Products*.

Commodities in Short Supply

Aluminum (3); Aluminum Products; Brass; Caustic; Corrugate; Electrical Components (16); Electronic Components (14); Epoxy; Labor — Temporary (9); Ocean Freight; Paper; Plastic Resins — Other (11); Printed Circuit Board Assemblies; Ridged Plastic Packaging Products; Semiconductors (14); and Steel Products.

Note: The number of consecutive months the commodity is listed is indicated after each item.

*Indicates both up and down in price.

January 2022 Manufacturing Index Summaries

Manufacturing PMI®

Manufacturing grew in January, as the Manufacturing PMI registered 57.6 percent, 1.2 percentage points lower than the seasonally adjusted December reading of 58.8 percent. “The Manufacturing PMI continued to indicate strong sector expansion and U.S. economic growth in January. All five subindexes that directly factor into the Manufacturing PMI® were in growth territory. All of the six biggest manufacturing industries expanded, in the following order: Machinery; Food, Beverage & Tobacco Products; Transportation Equipment; Computer & Electronic Products; Chemical Products; and Petroleum & Coal Products. The New Orders and Production indexes remained at strong levels. The Supplier Deliveries Index slightly softened but continued to reflect suppliers’ difficulties in maintaining delivery rates. All 10 of the subindexes were positive for the period; a reading of ‘too low’ for the Customers’ Inventories Index is considered a positive for future production,” says Fiore. A reading above 50 percent indicates that the manufacturing economy is generally expanding; below 50 percent indicates that it is generally contracting.

A Manufacturing PMI above 48.7 percent, over a period of time, generally indicates an expansion of the overall economy. Therefore, the January Manufacturing PMI indicates the overall economy grew in January for the 20th consecutive month following contraction in April and May 2020. “The past relationship between the Manufacturing PMI and the overall economy indicates that the Manufacturing PMI® for January (57.6 percent) corresponds to a 3.1-percent increase in real gross domestic product (GDP) on an annualized basis,” Fiore said.

THE LAST 12 MONTHS

Month Manufacturing

PMI®

Month Manufacturing

PMI®

Jan 2022 57.6 Jul 2021 59.9
Dec 2021 58.8 Jun 2021 60.9
Nov 2021 60.6 May 2021 61.6
Oct 2021 60.8 Apr 2021 60.6
Sep 2021 60.5 Mar 2021 63.7
Aug 2021 59.7 Feb 2021 60.9
Average for 12 months – 60.5

High – 63.7

Low – 57.6


New Orders

ISM’s New Orders Index registered 57.9 percent in January, a decrease of 3.1 percentage points compared to the seasonally adjusted 61 percent reported in December. This indicates that new orders grew for the 20th consecutive month. “Five of the six largest manufacturing sectors — Food, Beverage & Tobacco Products; Computer & Electronic Products; Transportation Equipment; Machinery; and Chemical Products — expanded at moderate to strong levels,” says Fiore. A New Orders Index above 52.9 percent, over time, is generally consistent with an increase in the Census Bureau’s series on manufacturing orders (in constant 2000 dollars).

Eleven of 18 manufacturing industries reported growth in new orders in January, in the following order: Apparel, Leather & Allied Products; Furniture & Related Products; Primary Metals; Fabricated Metal Products; Food, Beverage & Tobacco Products; Computer & Electronic Products; Electrical Equipment, Appliances & Components; Transportation Equipment; Plastics & Rubber Products; Machinery; and Chemical Products. The two industries reporting a decline in new orders in January are: Textile Mills; and Petroleum & Coal Products.

New Orders %Higher %Same %Lower Net Index
Jan 2022 25.0 60.5 14.5 +10.5 57.9
Dec 2021 24.6 64.6 10.8 +13.8 61.0
Nov 2021 23.4 66.0 10.6 +12.8 61.4
Oct 2021 29.7 58.3 12.0 +17.7 60.6


Production

The Production Index registered 57.8 percent in January, 1.6 percentage points lower than the seasonally adjusted December reading of 59.4 percent, indicating growth for the 20th consecutive month. “Four of the top six industries — Machinery; Transportation Equipment; Chemical Products; and Food, Beverage & Tobacco Products — expanded at moderate to strong levels. Shortages of raw materials and labor (due to omicron-fueled unplanned absenteeism) are a constraint to production growth at respondents’ companies. Panelist sentiment on labor and material shortages, however, improved for a third month in spite of COVID-19 obstacles,” says Fiore. An index above 52.4 percent, over time, is generally consistent with an increase in the Federal Reserve Board’s Industrial Production figures.

The 10 industries reporting growth in production during the month of January — listed in order — are: Furniture & Related Products; Primary Metals; Wood Products; Fabricated Metal Products; Machinery; Transportation Equipment; Miscellaneous Manufacturing; Electrical Equipment, Appliances & Components; Chemical Products; and Food, Beverage & Tobacco Products. The three industries reporting a decrease in January are: Apparel, Leather & Allied Products; Textile Mills; and Computer & Electronic Products.

Production %Higher %Same %Lower Net Index
Jan 2022 21.9 65.7 12.4 +9.5 57.8
Dec 2021 25.6 57.0 17.4 +8.2 59.4
Nov 2021 30.3 57.3 12.4 +17.9 60.2
Oct 2021 31.3 54.3 14.4 +16.9 59.0


Employment

ISM’s Employment Index registered 54.5 percent in January, 0.6 percentage point above the seasonally adjusted December reading of 53.9 percent. “The index reported a fifth consecutive month of expansion. Of the six big manufacturing sectors, five (Petroleum & Coal Products; Machinery; Food, Beverage & Tobacco Products; Transportation Equipment; and Computer & Electronic Products) expanded. Survey panelists’ companies are still struggling to meet labor-management plans, but for a fifth month, there were modest signs of progress: An increasing share of comments (11 percent in January, up from 7 percent in December) noted greater hiring ease. An overwhelming majority of panelists again indicate their companies are increasing head counts or attempting to, as 84 percent of Employment Index comments were hiring focused. Among those respondents, 31 percent expressed difficulty in filling positions, down from 37 percent in December. Rising concerns regarding turnover rates (44 percent cited backfills and retirements, an increase from 32 percent in December) continued a trend that began in August,” says Fiore. An Employment Index above 50.5 percent, over time, is generally consistent with an increase in the Bureau of Labor Statistics (BLS) data on manufacturing employment.

Of 18 manufacturing industries, nine industries reported employment growth in January, in the following order: Apparel, Leather & Allied Products; Miscellaneous Manufacturing; Electrical Equipment, Appliances & Components; Petroleum & Coal Products; Machinery; Furniture & Related Products; Food, Beverage & Tobacco Products; Transportation Equipment; and Computer & Electronic Products. The five industries reporting a decrease in employment in January are: Paper Products; Primary Metals; Nonmetallic Mineral Products; Chemical Products; and Plastics & Rubber Products.

Employment %Higher %Same %Lower Net Index
Jan 2022 19.2 65.7 15.1 +4.1 54.5
Dec 2021 15.5 72.2 12.3 +3.2 53.9
Nov 2021 20.5 64.6 14.9 +5.6 53.0
Oct 2021 21.3 62.8 15.9 +5.4 52.1


Supplier Deliveries†

The delivery performance of suppliers to manufacturing organizations was slower in January, as the Supplier Deliveries Index registered 64.6 percent, 0.3 percentage point lower than the 64.9 percent reported in December. All of the six top manufacturing industries (Food, Beverage & Tobacco Products; Computer & Electronic Products; Machinery; Transportation Equipment; Petroleum & Coal Products; and Chemical Products, in that order) reported slowing deliveries. “Deliveries slowed at a slightly slower rate compared to the previous month. The index continues to reflect suppliers’ difficulties in meeting demand from panelist companies, as the omicron variant swept through suppliers and the transportation sector, reversing a trend of improvement that began in November. Suppliers are expected to be back on track in February, moving toward a better supply-and-demand balance in March. Capital Expenditures lead times continue at modern-era records. After 5-percent improvement from the previous month was erased in January, lead times for Production Materials remain at near-record levels,” says Fiore. (For more data on lead times, see the Buying Policy section.) A reading below 50 percent indicates faster deliveries, while a reading above 50 percent indicates slower deliveries.

Sixteen of 18 industries reported slower supplier deliveries in January, in the following order: Apparel, Leather & Allied Products; Nonmetallic Mineral Products; Miscellaneous Manufacturing; Paper Products; Textile Mills; Food, Beverage & Tobacco Products; Computer & Electronic Products; Machinery; Transportation Equipment; Petroleum & Coal Products; Chemical Products; Primary Metals; Fabricated Metal Products; Plastics & Rubber Products; Electrical Equipment, Appliances & Components; and Furniture & Related Products. The only industry reporting faster supplier deliveries in January as compared to December is Wood Products.

Supplier Deliveries %Slower %Same %Faster Net Index
Jan 2022 34.4 60.4 5.2 +29.2 64.6
Dec 2021 34.7 60.5 4.8 +29.7 64.9
Nov 2021 48.2 48.1 3.7 +44.5 72.2
Oct 2021 52.5 46.1 1.4 +51.1 75.6


Inventories

The Inventories Index registered 53.2 percent in January, 1.4 percentage points lower than the seasonally adjusted 54.6 percent reported for December. “Manufacturing inventories continued to expand but at a slower rate. Due to supplier labor and transportation issues in January, the end-of-year inventory draw down that occurred in December could not be fully replenished. Inventories Index readings are expected to improve in February and March,” says Fiore. An Inventories Index greater than 44.4 percent, over time, is generally consistent with expansion in the Bureau of Economic Analysis (BEA) figures on overall manufacturing inventories (in chained 2000 dollars).

The 12 industries reporting higher inventories in January — in the following order — are: Apparel, Leather & Allied Products; Nonmetallic Mineral Products; Furniture & Related Products; Textile Mills; Miscellaneous Manufacturing; Transportation Equipment; Primary Metals; Machinery; Electrical Equipment, Appliances & Components; Computer & Electronic Products; Fabricated Metal Products; and Chemical Products. Only Paper Products reported contracting inventories in January.

Inventories %Higher %Same %Lower Net Index
Jan 2022 21.8 62.7 15.5 +6.3 53.2
Dec 2021 21.6 61.7 16.7 +4.9 54.6
Nov 2021 26.2 58.1 15.7 +10.5 56.3
Oct 2021 28.0 57.8 14.2 +13.8 56.4


Customers’ Inventories†


ISM’s Customers’ Inventories Index registered 33 percent in January, 1.3 percentage points higher than the 31.7 percent reported for December, indicating that customers’ inventory levels were considered too low. “Customers’ inventories are too low for the 64th consecutive month, a positive for future production growth. For 18 straight months, the Customers’ Inventories Index has been at historically low levels,” says Fiore.

No industries reported higher customers’ inventories in January. The 11 industries reporting customers’ inventories as too low during January — listed in order — are: Apparel, Leather & Allied Products; Fabricated Metal Products; Paper Products; Machinery; Transportation Equipment; Miscellaneous Manufacturing; Chemical Products; Furniture & Related Products; Computer & Electronic Products; Food, Beverage & Tobacco Products; and Primary Metals. Seven industries reported no change in customers’ inventories when comparing January’s levels to December.

Customers’ Inventories % Reporting %Too High %About Right %Too Low Net Index
Jan 2022 74 8.6 48.9 42.5 -33.9 33.0
Dec 2021 77 8.7 46.1 45.2 -36.5 31.7
Nov 2021 77 5.4 39.3 55.3 -49.9 25.1
Oct 2021 78 6.7 50.1 43.2 -36.5 31.7


Prices†

The ISM Prices Index registered 76.1 percent, an increase of 7.9 percentage points compared to the December reading of 68.2 percent, indicating raw materials prices increased for the 20th consecutive month, at a faster rate in January. This is the 17th month in a row that the index has been above 60 percent. “Aluminum; corrugate and packaging materials; copper; electrical and electronic components; petroleum products; vegetable oils; lumber; freight; rubber-based products; and steel products continue to remain at elevated prices due to product scarcity amongst high demand,” says Fiore. A Prices Index above 52.6 percent, over time, is generally consistent with an increase in the Bureau of Labor Statistics (BLS) Producer Price Index for Intermediate Materials.

In January, 17 industries reported paying increased prices for raw materials, in the following order: Apparel, Leather & Allied Products; Textile Mills; Nonmetallic Mineral Products; Paper Products; Food, Beverage & Tobacco Products; Furniture & Related Products; Computer & Electronic Products; Miscellaneous Manufacturing; Transportation Equipment; Petroleum & Coal Products; Primary Metals; Chemical Products; Electrical Equipment, Appliances & Components; Machinery; Wood Products; Fabricated Metal Products; and Plastics & Rubber Products. No industry reported paying decreased prices for raw materials.

Prices %Higher %Same %Lower Net Index
Jan 2022 58.7 34.8 6.5 +52.2 76.1
Dec 2021 47.4 41.6 11.0 +36.4 68.2
Nov 2021 67.9 29.0 3.1 +64.8 82.4
Oct 2021 72.3 26.7 1.0 +71.3 85.7


Backlog of Orders†


ISM’s Backlog of Orders Index registered 56.4 percent in January, a 6.4-percentage point decrease compared to the 62.8 percent reported in December, indicating order backlogs expanded for the 19th straight month. “Backlogs expanded at a slower rate in January; however, the index reading indicates incoming business remains high. The expansion is at its slowest rate since October 2020, when the Backlog of Orders Index registered 55.7 percent — a historically normal level. Five of the six big industry sectors (Food, Beverage & Tobacco Products; Machinery; Transportation Equipment; Chemical Products; and Computer & Electronic Products) reported that backlogs expanded strongly,” says Fiore.

The 11 industries reporting growth in order backlogs in January, in the following order, are: Apparel, Leather & Allied Products; Textile Mills; Furniture & Related Products; Fabricated Metal Products; Food, Beverage & Tobacco Products; Machinery; Primary Metals; Miscellaneous Manufacturing; Transportation Equipment; Chemical Products; and Computer & Electronic Products. The two industries reporting lower backlogs in January are: Wood Products; and Nonmetallic Mineral Products.

Backlog of Orders % Reporting %Higher %Same %Lower Net Index
Jan 2022 93 24.7 63.5 11.8 +12.9 56.4
Dec 2021 90 38.0 49.7 12.3 +25.7 62.8
Nov 2021 92 35.2 53.3 11.5 +23.7 61.9
Oct 2021 91 36.4 54.4 9.2 +27.2 63.6


New Export Orders†

ISM’s New Export Orders Index registered 53.7 percent in January, up 0.1 percentage point compared to the December reading of 53.6 percent. “The New Export Orders Index grew for the 19th consecutive month, at a slightly faster rate in January. Of the six big industry sectors, five (Machinery; Food, Beverage & Tobacco Products; Computer & Electronic Products; Transportation Equipment; and Chemical Products) expanded. Export levels of U.S. manufactured products remain a positive for the U.S. manufacturing economy, as our overseas customers continue to face sluggish growth,” says Fiore.

The eight industries reporting growth in new export orders in January — in the following order — are: Miscellaneous Manufacturing; Plastics & Rubber Products; Primary Metals; Machinery; Food, Beverage & Tobacco Products; Computer & Electronic Products; Transportation Equipment; and Chemical Products. The two industries reporting a decrease in new export orders in January are: Wood Products; and Paper Products. Seven industries reported no change in exports in January as compared to December.

New Export Orders % Reporting %Higher %Same %Lower Net Index
Jan 2022 73 12.5 82.3 5.2 +7.3 53.7
Dec 2021 75 10.8 85.5 3.7 +7.1 53.6
Nov 2021 76 11.3 85.5 3.2 +8.1 54.0
Oct 2021 75 12.7 83.9 3.4 +9.3 54.6


Imports†


ISM’s Imports Index registered 55.1 percent in January, an increase of 1.3 percentage points compared to December’s figure of 53.8 percent. “Imports expanded in January for the third consecutive month, in spite of continuing challenges with throughput at U.S. ports of entry. Overland transport challenges and container shortages continue to persist across the global supply chain in the buildup prior to Lunar New Year. However, there were signs of improvement in the month of January, based on panelists’ comments. Imports will continue to be challenged through the first half of 2022, though, due to the pandemic,” says Fiore.

The nine industries reporting growth in imports in January — in the following order — are: Furniture & Related Products; Nonmetallic Mineral Products; Transportation Equipment; Electrical Equipment, Appliances & Components; Miscellaneous Manufacturing; Machinery; Computer & Electronic Products; Food, Beverage & Tobacco Products; and Chemical Products. Two industries — Plastics & Rubber Products; and Fabricated Metal Products — reported lower volumes of imports in January as compared to December. Seven industries reported no change in imports in January.

Imports % Reporting %Higher %Same %Lower Net Index
Jan 2022 84 18.4 73.4 8.2 +10.2 55.1
Dec 2021 83 17.9 71.8 10.3 +7.6 53.8
Nov 2021 87 14.1 77.0 8.9 +5.2 52.6
Oct 2021 86 12.5 73.3 14.2 -1.7 49.1


†The Supplier Deliveries, Customers’ Inventories, Prices, Backlog of Orders, New Export Orders, and Imports indexes do not meet the accepted criteria for seasonal adjustments.

Buying Policy

Average commitment lead time for Capital Expenditures in January was 167 days, an increase of six days compared to December. Capital Expenditures lead times have increased in 10 of the last 12 months for a net increase of 25 days since February 2021 (142 days). Average lead time in January for Production Materials increased by four days to 95 days. Average lead time for Maintenance, Repair and Operating (MRO) Supplies was 46 days, down two days compared to December.

Percent Reporting
Capital Expenditures Hand-to-Mouth 30 Days 60 Days 90 Days 6 Months 1 Year+ Average Days
Jan 2022 21 4 6 13 29 27 167
Dec 2021 21 3 11 11 29 25 161
Nov 2021 19 4 10 15 27 25 160
Oct 2021 19 5 9 15 29 23 156
Percent Reporting
Production Materials Hand-to-Mouth 30 Days 60 Days 90 Days 6 Months 1 Year+ Average Days
Jan 2022 9 23 23 24 13 8 95
Dec 2021 10 21 24 24 15 6 91
Nov 2021 10 21 22 26 13 8 96
Oct 2021 10 19 25 23 16 7 96
Percent Reporting
MRO Supplies Hand-to-
Mouth 30 Days 60 Days 90 Days 6 Months 1 Year+ Average
Days
Jan 2022 28 36 18 13 4 1 46
Dec 2021 26 34 21 14 4 1 48
Nov 2021 29 34 21 12 3 1 44
Oct 2021 25 35 20 14 5 1 49


Posted: February 1, 2022

Source: Institute for Supply Management

MAS Holdings Announces Company-Wide Sustainability Strategy: Plan for Change

COLOMBO, Sri Lanka — February 1, 2022 — MAS Holdings, the Sri Lanka-based design to delivery solutions provider, announces its company-wide sustainability strategy, the MAS Plan For Change. Knowing it operates in an industry with a large negative impact, The Plan For Change outlines three focus areas to improve its operations: Product, Lives, and Planet, with twelve goals to be achieved by 2025. MAS has also recently signed up for the Science Based Targets initiative (SBTi) with commitments to reduce absolute scope 1 and 2 GHG emissions 25.2% by 2025 from a 2019 base year, and further commits that 85% of its suppliers by spend and 100% of joint ventures in scope 3 investments, will have science-based targets by 2025. The Plan For Change is a commitment to inspiring sustainable change within its operations, amongst its customers, communities, and for the planet as a whole.

MAS Holdings is the largest apparel tech company in South Asia, headquartered in Colombo, Sri Lanka with facilities in 15 countries, powered by over 100,000 employees globally.

Since its founding in 1987, MAS has prioritized employee wellbeing based on a founding principle of doing the right thing and providing safe, secure, and comfortable places of work, with fair, equitable wages for team members. This core principle percolates to all areas of business, including the relationships built with brand customers, work in local communities, the ethical treatment of people, and actions towards the natural environment. Over three decades, MAS created many programs and initiatives aimed at improving workers’ lives, the products it makes, and the planet. MAS acknowledges that the industry it operates in has significant negative impacts and it is doing its part to mitigate these effects. The Plan For Change combines the work of these individual programs and formalizes the goals into one cohesive strategy to be carried out across the group.

While the Plan For Change is a new strategic approach to the company’s product, social and environmental goals, MAS has been dedicated to uplifting people and the planet since its inception.  Progress towards sustainability is an ongoing journey for the company and is demonstrated by its long-standing membership in the UN Global Compact (since 2003), signing of the Women’s Empowerment Principles, commitment to reaching many of the UN Sustainable Development Goals, and partnerships with the IFC, SAC, ZDHC and many others. MAS recognizes that addressing many of the challenges the world and its inhabitants face requires sustainable, systemic change and is committed to doing so through ambitious, collaborative initiatives.

“Whether it be climate disasters, overconsumption, inequality, wars, and pandemics, we have witnessed how prolonged, unchecked human activity has negatively impacted our industry and our world. That is why we have established this Plan as the blueprint to create positive change; and we are inspired by these ambitious goals that we have set for ourselves. Achieving them will require unprecedented levels of innovation, collaboration, and alignment among our businesses, partners, and supply chain. We are excited to embrace this challenge and hope to create impactful change. We know that the road is long and will challenge us, but just as our founders were, we are committed to staying the course of doing the right thing,” – Sid Amalean, Head of Sustainable Business, MAS Holdings.

Products

With a focus on innovation, sourcing sustainably, and pioneering circularity at scale, MAS aims to increase its sustainable product offerings to 50% of its revenue by 2025. Improving products to make them last longer, use fewer resources, and be recycled after use are at the core of the strategy to produce quality goods to combat disposability. Attention to sustainable sourcing will be achieved by partnering with MAS’ supply chain to select sustainable alternatives to raw materials. Progress towards realizing this goal has already been demonstrated through its partnership with Eco Spindles to create the Sri Lankan Cricket World Cup jerseys from discarded PET in 2019, 2020, and 2021. In 2020 alone, MAS companies recycled over 21 million plastic bottles to create fabric for its customers. Closing the loop on circular production is paramount for MAS, and strategic partnerships are key for it to achieve this goal.

Lives

Understanding that its employees and the local communities are its greatest assets, MAS aims to empower women, provide meaningful employment, world-class workplaces and enable positive impact to create thriving communities.

To support the largely female population in the workplace (70%) MAS launched Women Go Beyond in 2003, a robust portfolio of programs to prevent gender-based violence, empower, educate, provide skill development, leadership development, and career advancement for women. Women Go Beyond is MAS’ hallmark female empowerment platform that adheres to the UN Women’s Empowerment Principles; since its inception in 2003, Women Go Beyond has created 3.7 million opportunities for women within MAS and its communities. To support mothers, MAS offers pre-and post-natal programs, on/off-site childcare facilities, and lactation rooms among other benefits. Through these programs, MAS aims to empower 100% of women on the factory floor and increase gender representation in management to 30% by 2025.

The Plan For Change also strives to foster diversity & inclusion, ensure & elevate sustainable compensation, accelerate employee well-being & work-life balance, and provide world-class working conditions for all employees, as well as enable positive impact in all communities. For MAS, a positive work environment means an inclusive one; since its early stages of business, MAS has supported employees with disabilities and currently employs 380 persons with disabilities ranging from vision, speech, hearing, and cognitive to physical impairments. It applies the 4E model (Employ, Enable, Engage, and Empower) for employees with disabilities and provides training to non-disabled employees such as the ‘Talking Hands’ initiative which trains non-impaired employees in sign language to promote an integrated and inclusive workplace. After seeing many local businesses suffer as a result of the COVID-19 pandemic, MAS launched Rise Up with MAS which financed micro-businesses within localities where the company operates, to mitigate the adverse impacts of the pandemic and allow for the entrepreneurs to restart or expand their businesses.

Planet

Knowing it operates in an industry with a large negative impact, MAS has committed to reduce absolute scope 1 and 2 GHG emissions 25.2% by 2025 from a 2019 base year. The goal is in line with the 1.5°C target outlined in the Paris Agreement and was recently accepted by the Science Based Target initiative (SBTi). Additionally, MAS has committed to value enhance (upcycle) 100% of non-hazardous waste, be zero toxic in all products and processes, safeguard water, and restore biodiversity in 100x the space it occupies.

To partially address emissions reduction, Project Photon, a multi-roof solar panel initiative started in 2017, was implemented.  Currently, 48,000 solar panels cover 18 MAS facilities, contributing to 57% renewable energy usage across its global operations. As part of its goal to value enhance waste, MAS has created Eco-Brick at MAS Fabric Park, which converts textile sludge to bricks, as a way of addressing the problem of ETP sludge and effluent waste within MAS while simultaneously providing building materials for the company. Currently, 98% of the chemicals the manufacturer uses are compliant with the ZDHC’s Level 1 MRSL, bringing MAS closer to its goal of zero toxicity by 2025. MAS has also begun work on its commitment to restoring biodiversity in 100x the space it occupies, equating to 25,000 acres. Forty-five habitat restoration projects such as aerial reforestation, invasive removal and restoration, and analog forestry have been carried out across Sri Lanka, accounting for  2551 acres restored as of 2020.

MAS is determined to make sustainable and ethical strides by 2025 and the challenges of 2020 have not impeded MAS’ vision for a more sustainable and equitable future. By implementing this company-wide strategy, MAS Holdings aims to have a large-scale positive impact on products, lives, and the planet changed for good.

Posted: February 1, 2022

Source: MAS HOLDINGS Pvt LTD

Marine Fabricators Association Announces Marine Fabrication Excellence Award Winners

ROSEVILLE, Minn. — February 1, 2022 — Sponsored by the Marine Fabricators Association (MFA), the Fabrication Excellence Awards contest is designed to recognize excellence in marine fabrication. The entries are judged by a panel of certified marine professionals. Awards of Excellence and Outstanding Achievement Awards are given in each category.

Winners were selected based on complexity, design, workmanship, uniqueness and function. Recipients of the “Award of Excellence”, “Outstanding Achievement Award” and “Award of Distinction” were also all recognized at the conference. Winning projects will receive recognition in press releases, features in Marine Fabricator magazine, an award plaque and permission to use the Fabrication Excellence winning logo in business and promotional pieces.

For this year’s competition, the MFA received a total of 68 entries from marine fabricators in 11 categories including; enclosures, sailboats, travel covers, tops, upholstery and miscellaneous. Judges included industry experts and certified professionals. Watch for the March/April Marine Fabricator publication for all winning project details. To view a gallery of similar projects from other award programs click here.

The Marine Fabrication Excellence Awards competition is sponsored by Industrial Fabrics Association International (IFAI), a not-for-profit trade association with more than 1,600 member companies representing the international specialty fabrics and technical textiles marketplace.

Outstanding Achievement

  • Bootssattlerei Hallier
    • Project Name: Activ 805 Sundeck Quicksilver
    • Category: Travel/Full Covers
  • Bootssattlerei Hallier
    • Project Name: Regal 2565
    • Category: Powerboat—Soft Enclosures
  • Charlton’s Marine Canvas
    • Project Name: Salt Life Silverton
    • Category: Powerboat—Rigid Enclosures
  • Lake Shore Boat Top Co. Inc.
    • Project Name: “Blue by You”—Yamaha Makeover
    • Category: Wild & Innovative
  • Lake Shore Boat Top Co. Inc.
    • Project Name: “Fish Bowl”–Cruisers Yacht 560a
    • Category: Hybrid Enclosures
  • MarineRennavators LLC
    • Project Name: Cockpit Shade with Custom Carbon Fiber Poles
    • Category: Wild & Innovative
  • Mike’s Marine Custom Canvas
    • Project Name: Bertram Transformer Top
    • Category: Tops
  • Mike’s Marine Custom Canvas
    • Project Name: Prestige
    • Category: Hybrid Enclosures
  • SewLong Custom Covers
    • Project Name: Surf Sail—AFT Shade Sail Extension
    • Category: Tops
  • Signature CanvasMakers LLC
    • Project Name: Classy Cobia
    • Category: Powerboat—Soft Enclosures
  • Top Stitch Marine Canvas
    • Project Name: Modernized Sea Ray
    • Category: Marine Exterior Upholstery
  • Top Stitch Marine Canvas
    • Project Name: Upholstery Upgrade
    • Category: Marine Exterior Upholstery
  • Yachtsman’s Canvas
    • Project Name: Glass House
    • Category: Powerboat—Rigid Enclosures

Award of Excellence

  • Bootssattlerei Hallier
    • Project Name: Formenti ZAR 95
    • Category: Powerboat—Soft Enclosures
  • Bootssattlerei Hallier
    • Project Name: Sea Ray 260 Sundeck
    • Category: Wild & Innovative
  • Charlton’s Marine Canvas
    • Project Name: Endeavor Cat 44
    • Category: Hybrid Enclosures
  • Charlton’s Marine Canvas
    • Project Name: Sew Smooth
    • Category: Powerboat–Rigid Enclosures
  • Custom Marine Canvas
    • Project Name: Arriva Tender Cover
    • Category: Travel/Full Covers
  • Custom Marine Canvas
    • Project Name: Snow Goose Cushions
    • Category: Marine Interior Upholstery
  • In Stitches Customs
    • Project Name: Fountain of Youth
    • Category: Marine Exterior Upholstery
  • K1 Marine Trimming Pty Ltd.
    • Project Name: CNB 60 Sailing in Comfort
    • Category: Sailboat Enclosures
  • Lake Shore Boat Top Co. Inc.
    • Project Name: “All Covered Up”—250 Boston Whaler
    • Category: Travel/Full Covers
  • Lake Shore Boat Top Co. Inc.
    • Project Name: “Goose Landing Pad”—Skin Top
    • Category: Tops
  • Weaver Canvas
    • Project Name: Aft Shade for 78-Foot Marlow with Carbon Fiber Poles
    • Category: Marine Miscellaneous
  • Yachtsman’s Canvas
    • Project Name: Traditional Beauty
    • Category: Sailboat Dodgers

Award of Distinction

  • Bootssattlerei Hallier
    • Project Name: Formenti ZAR 95
    • Category: Powerboat—Soft Enclosures
  • In Stitches Customs
    • Project Name: Fountain of Youth
    • Category: Marine Exterior Upholstery

Posted: February 1, 2022

Source: Industrial Fabrics Association International (IFAI)

TAYA Groups Announces Strategic Appointment To Meet Growing Demand For KAVALAN In Europe

TAIWAN — February 1, 2022 — TAYA Groups today announces a new appointment within its international workforce as Rob Karpenko joins the business as director of sales for TAYA Europe. The newly-created role forms part of a strategic plan to further develop and strengthen the PVC-free KAVALAN brand in the European market, where demand for high-quality, environmentally-responsible materials continues to grow.

Rob Karpenko brings with him more than 20 years of industry experience, having held a number of Senior international positions with leading Multinationals in the Viscom area. Based in Geneva, Rob will focus on fostering new and existing relationships with KAVALAN partners across Europe, building on the brand’s strong reputation and utilising the robust Life Cycle Analysis and Eco Calculator data in order to empower more global businesses to embark on a successful PVC-free journey.

Speaking about his new role, Karpenko commented: “There’s no doubt that the KAVALAN product range is the future — the end of PVC is already well underway. The requirement for my new role on the ground in Europe to build on KAVALAN’s already stellar results is proof of where the industry is heading. I’m excited to be that person leading the charge in the region and to be working with such a skilled and passionate team.”

Vincent Lin, vice president, TAYA Groups, commented: “We’re delighted to be bolstering our presence in the European market and are very pleased to have Rob Karrpenko as the driving force behind KAVALAN’s expansion across the continent. We’re seeing strong demand globally for quality, reliable materials that don’t harm the planet. Therefore it’s absolutely the right time to bring an additional champion for KAVALAN on board in Europe, who can continue building strong relationships with our valued international partners.”

Posted: February 1, 2022

Source: TAYA Groups

Avery Dennison Acquires TexTrace, An Innovator In Integrated RFID Products

GLENDALE, Calif./FRICK, Switzerland — February 1, 2022 — Avery Dennison Corp. today announced that it has acquired TexTrace AG (TexTrace), a technology developer that specializes in custom-made woven and knitted RFID products which can be sewn onto or inserted into garments. TexTrace was formerly a subsidiary of Jakob Müller Holding, an OEM company for the textile industry located in Frick, Switzerland. The acquisition includes ownership of TexTrace’s portfolio of intellectual property, and its employees that will continue to be based in Frick, Switzerland, enabling Avery Dennison to continue to innovate and drive adoption within the apparel sector and unlock opportunities in non-apparel segments.

The innovative technology developed by TexTrace provides the opportunity to fully integrate RFID into garments. Brand labels with built-in RFID are an all-in-one solution for product branding, brand and theft protection, product availability, consumer interaction and enhanced convenience, such as self checkout. In the future, it could offer unprecedented supplier and materials information to enable the circular economy through reccommerce and recycling, providing the opportunity to gain insights into the true carbon footprint of the garment.

“This is an exciting acquisition for Avery Dennison, expanding our digital ID portfolio to offer integrated RFID solutions for the apparel industry. The innovative woven and knitted RFID products that TexTrace has developed, will add significant value to the traditional way the apparel and retail sector uses RFID, creating the opportunity for a more sustainable and intelligent future where digital ID’s can live with the life of the garment”, said Francisco Melo, vice president and general manager, Avery Dennison Smartrac.

“This step is a great opportunity and a groundbreaking decision for the future of TexTrace AG. We are proud of what the start-up has achieved in its 10-year company history and we are very pleased that we can now enable it to take the next step in it’s progression. This comes at the right time with the right partner”, said Stephan Bühler, co-owner of Jakob Müller Holding AG and previous CEO of TexTrace AG.

Posted: February 1, 2022

Source: Avery Dennison/TexTrace AG

Archroma Launches EARTH SOFT System Based On Siligen® EH1, A New Vegan Textile Softener With One-Third Plant-Based Active Content

PRATTELN, Switzerland — February 1, 2022 — Archroma, a global supplier of specialty chemicals towards sustainable solutions, today announced the launch of EARTH SOFT, a new softening system for textile and fashion applications, based on Archroma’s latest innovation, a vegan silicone softener, Siligen® EH1, with 35-percent plant-based active content.

Siligen EH1 is the latest addition in the plant-based innovations developed by Archroma in recent years, such as EarthColors® dyes and Appretan® NTR binders, as alternatives offered to manufacturers and brands looking to reduce the use of fossil fuel based ingredients without compromising performance.

The range has been developed in line with the principles of “The Archroma Way to a sustainable world: safe, efficient, enhanced, it’s our nature”. More than 35 percent of the Siligen EH1 softener’s active content is based on plant-based, renewable raw materials. In addition, the product features ultralow cyclic siloxanes (D4, D5, D6) which are classified by the European Chemicals Agency as “Substances of Very High Concern” due to their very persistent and bioaccumulative properties.

Siligen EH1 is ideally suited for shirts, underwear, sportswear, towels, bed sheets, etc. as it provides an excellent wearing comfort by supporting a good moisture transportation and delivering a smooth and soft touch.

The new softener, and the EARTH SOFT system which also includes a Hydroperm® wicking agent to boost hydrophilic properties on synthetic and blended fibers, can be applied on all natural and synthetic textile fibers.

Siligen EH1 is suitable for both woven and knitted articles. It can be applied by padding process, as well as by exhaust process as it shows a very good shear stability and a low foaming profile. It can be used on white articles and those treated with optical brighteners, as it doesn’t cause thermomigration nor phenolic yellowing.

Paul Cowell, head of Competence Centers for Brand & Performance Textile Specialties at Archroma, commented: “The new EARTH SOFT system based on Siligen EH1 softener adds to our growing portfolio of innovations based on natural and renewable plant-based resources. This new breakthrough innovation by Archroma helps us and our partners in the textile and fashion industry to minimize our dependence on petroleum fossil fuel products.”

Posted: February 1, 2022

Source: Archroma

High Energy Costs Undermine Crucial Transformation Of The Textile And Clothing Industry

BRUSSELS — January 31, 2022 — The current energy crisis is impacting on the competitiveness of the European textile and clothing industry. Because there are limited alternatives to the use of gas in different parts of the production process, production costs increase sharply. EURATEX asks the European Commission and Member States to urgently support the industry to avoid company closures. At the same time, we need a long-term vision to move towards climate neutrality, while keeping the T&C industry internationally competitive.

EURATEX presented ten key requirements to Kadri Simson, European Commissioner for Energy, to develop such a vision:

  1. The apparel and textile industry needs a safe supply with sufficient green energy (electricity and gas) at internationally competitive prices.
  2. The transformation of industry requires access to very significant amounts of renewable energy at competitive costs. Additional investments in infrastructure will also be needed to guarantee access to new renewable energy supplies.
  3. Until a global (or at least G 20 level) carbon price or other means for a global level playing field in climate protection are implemented, competitive prices for green energy must be granted at European or national levels (e.g. CCfDs, reduction on levies, targeted subsidies).
  4. As the European textile and clothing sector faces global competition mainly form countries/regions with less stringent climate ambitions, it is of utmost importance that the European textile and clothing companies are prevented form direct and indirect carbon leakage.
  5. EU-policy should support solutions, e.g. through targeted subsidies (for hydrogen, energy grids, R&D, technology roadmap studies etc.).
  6. A dedicated approach for SMEs might be appropriate as SMEs do not have the skills/know-how to further improve their energy efficiency and/or becoming carbon neutral.
  7. CAPEX and OPEX support will be necessary for breakthrough technologies, like hydrogen.
  8. The Fit-for-55-Package must support the European Textile and Clothing industry in decarbonization and carbon neutrality. The EU must therefore advocate a global level playing field more than before. The primary goal must be to establish an internationally uniform, binding CO2 pricing, preferably in the form of a standard at G-7 / G-20 level.
  9. EU-policy must not hinder solutions, e.g. we need reasonable state aid rules (compensating the gap between national energy or climate levies and a globally competitive energy price should not be seen as a subsidy).
  10. The European Textile and Clothing industry has made use of economically viable potentials to continuously improve energy efficiency over many years and decades. The obligation to implement further measures must be taken considering investment cycles that are in line with practice. Attention must be paid to the proportionality of costs without weakening the competitive position in the EU internal market or with competitors outside the EU.

Posted: February 1, 2022

Source: EURATEX

Sponsors