In Brief
– Expect a strong economy in 2000. Real GDP will expand by 3.7 percent after a strong
performance in 1999. This means business conditions will be sound, with virtually no risk of a
recession.
– Consumer spending, business investment and exports will drive 2000’s expansion.
– Our trade deficit for goods and services will deteriorate, exceeding $250 billion for the
second straight year.
– For the fourth year in a row, inflation will run under 2.5 percent.
– The Federal Reserve is likely to raise short-term interest rates one more time.
– Hiring will grow at a brisk rate with nonfarm payrolls rising by 2.0 percent after gaining
an estimated 2.2 percent in 1999.
– New homebuilding will be above the 1.5 million mark in 2000 for the third consecutive year.
– Growth in industrial output will pick up speed.
– Textile industry results overall will be mixed this year.
A year ago, the consensus forecast called for a sharp slowdown in U.S. economic growth in 1999,
while some forecasters had expected an outright recession in light of the economic conditions in
the Pacific Region and Latin America. Instead, the concerns turned out to be tight labor markets,
higher oil prices and the possibility of an overheating of the economy.
The Federal Reserve responded by raising interest rates three times for a total of
three-quarters of a point. Growth, estimated at 4.0 percent for 1999, was only slightly below the
1998 booming rate of 4.3 percent and the trend rate of 4.2 percent in the previous three years.
In November, nonfarm payrolls were up by more than 2.7 million jobs from a year ago and the
jobless rate was down to 4.1 percent, the lowest level in 30 years. Even though the labor market is
getting increasingly tighter, there is no evidence of acceleration in wage costs.
As oil prices soared to more than $25 per barrel by early December from about $12 per barrel
a year ago, the inflation rate moved up to 2.6 percent in November from a year ago. However, the
core consumer price index — which excludes food and energy — was up only 2.1 percent, which is down
from 2.4 percent in 1998 and close to the lowest rate in more than three decades.
Long-term rates, after falling to the early 1967 levels in 1998, moved up more than a full
percentage point to 6.2 percent in early December.
World Economy Improving
The world economy is improving with
the U.S. economy leading the way.
Asia has overcome many of the problems that led to the 1997 crisis and continues to gain
strength, while Europe is getting healthier. Latin America, excluding Mexico and Peru, has major
economic problems.
The NAFTA region, led by the United States, has remained strong in the recent financial
crisis. The United States has absorbed most of the rest of the world’s exports. Its trade deficit
in current dollars shot up to more than $250 billion last year from just $89 billion before the
Asian crisis.
Oil prices, after plunging to an average of $12.6 a barrel in 1998 from $18.8 a barrel in
1997, shot up to over $25 per barrel by November of last year.
U.S. Growth Strong
Even though overall U.S. growth was
strong in 1999, manufacturing grew modestly.
The overall factory operating rate, at 80.7 percent in November was down from 81.3 percent a
year ago. Manufacturing payrolls were slashed by more than a quarter million jobs in 1999.
Net exports of goods and services deteriorated by an estimated $104 billion in nominal
dollars and by $106 billion in real terms as growth of U.S. imports outpaced exports by more than a
3-to-1 ratio.
With inflation low in Western Europe — less than 1 percent in France and Germany, and below
2 percent for most other countries — and overall growth down to 1.9 percent in 1999 from 2.7
percent in 1998, the policy emphasis has shifted toward stimulating economic activity by employing
a more expansive fiscal policy.
With interest rates up, sharply higher oil prices and tight labor markets, the question is:
what will be their impact on the U.S. economy?
Despite all the concerns and signs of some slowing, expansion will remain on firm ground.
In January of this year, the current economic expansion will overtake the expansion of the
1960s and become the longest ever for the U.S. economy.
Growth And More Growth
The latest consensus forecast calls
for a 3.2-percent growth in U.S. economic activity in 2000, according to both the quarterly survey
of economic outlook by the National Association for Business Economics and the Federal Reserve Bank
survey of Professional Forecasters (3.1 percent).
Looking ahead, our econometric model of the U.S. economy forecasts that real GDP will rise
3.7 percent this year, following gains of 4.0 percent in 1999, 4.3 percent in 1998 and 4.5 percent
in 1997. Gains in consumer spending, business investment in equipment, and a rebound in exports
will power growth. Interest rates are likely to rise from current levels.
Job creation is expected to decelerate but remain strong enough to push the jobless rate
further down. Inflation will continue to be under control assuming there are no further increases
in oil prices beyond $25 per barrel.
Here are the main reasons for our positive outlook. The rebound in economic activity in Asia
raised demand for petroleum, which, combined with production cutbacks by the major oil-producing
countries, boosted oil prices to more than $25 per barrel last November.
The expected removal of the sanctions on Iraq’s oil production means that OPEC members will
either have to raise production quotas or lower their allotment to make room for Iraq’s additional
output. This means that oil prices are likely to come under pressure reversing their recent upward
trend.
Oil prices should drop from current levels to around $20 per barrel. This means that the
impact of higher energy prices on inflation would narrow and overall inflation would continue to be
under control leaving plenty of room for the Federal Reserve to wait before raising short-term
interest rates to keep the expansion going.
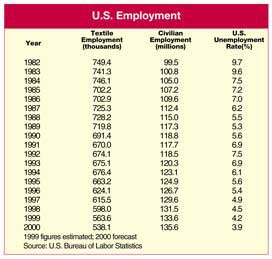
Low U.S. Employment
Since the unemployment rate for most
European countries is still at or near double-digit levels and inflation is below 2.0 percent,
expansionary fiscal policy in 2000 would lead to an improvement in Europe’s economic activity but
not higher inflation.
With the U.S. population growing by 1.0 percent a year and the labor force participation
rate rising by another 0.6 percent, the labor supply gain is capped at 1.6 percent a year. With the
economy adding 0.2 million jobs a month in 2000, the unemployment rate will continue to be low and
is likely to drop below 4.0 percent in 2000.
While there has been some pick-up in wage growth and employers have difficulty finding
qualified workers, the 4.6-percent rise in compensation from a year ago is in line with
productivity gains and current inflation. Faced with an increasingly tight labor market, companies
have stepped up capital spending to become more efficient to preserve profit margins. This is
evident in productivity gains. Many companies have added flexibility to labor costs by adopting
policies in which part of the compensation is tied to profitability.
Finally, in a low-inflation environment and excess capacity, the need for consolidation is
likely to accelerate this year. We estimate that as long as companies stay on course with increased
capital spending and tying compensation to profitability, a drop in the jobless rate below 4.0
percent is not going to result in an acceleration of labor costs. Wage rate increases will follow
inflation and productivity gains.
Inflation And Productivity
Global competition, new technologies
and excess capacity around the globe have changed the dynamics of inflation and productivity. This
leaves little room for U.S. producers to raise their domestic or export prices. Thus, the focus
will be on increasing productivity to remain competitive and maintain profitability. This in turn
will intensify competition.
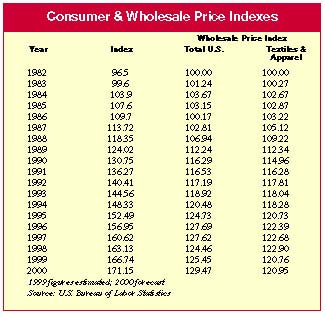
With the inflation rate at 2.2 percent last year and below 3.0 percent for the seventh year
in a row, wage increases tied to labor contracts will be modest.
Assuming no major surprise, food prices will be well behaved this year and are expected to
move up not more than the overall inflation rate. The only wild card is energy prices. While the
average acquisition price of oil is expected to be up 33 percent from $17.1 per barrel in 1999, oil
prices are seen coming down from current levels.
Thus, low inflation and a low unemployment rate will continue to coexist for another year.
Year-over-year inflation is seen rising by 2.5 percent in 2000, up from 2.2 percent in 1999 and the
three-decade low of 1.6 percent in 1998 brought about by the collapse of oil prices in the
aftermath of Asian crisis.
Foreign Exchange Markets
The effect of a pickup in U.S.
exports growth and a gradual decline of the value of the dollar in foreign exchange markets on
profits from foreign operations will be positive. Furthermore, with the overall industrial
operating rate moving up to 81.5 percent from 80.6 percent in 1999, capital spending on plant and
equipment in manufacturing will improve a bit. However, the big boost in capital spending on
equipment in the last four years came from investment in information and telecommunications-related
equipment. This trend is expected to continue in 2000.
The absence of capital spending related to the Y2K replacement of information-related
equipment is not likely to result in a precipitous drop in investment, as capital outlays on new
technologies will make up the difference.
Despite higher interest rates, the creation of new jobs will be enough to stimulate further
investment in structures. Real nonresidential investment is seen growing 9.1 percent following
gains of 9.2 percent in 1999, 12.7 percent in 1998 and 10.7 percent in 1997.
Strong Job Market
As the nation’s output of goods and
services expands by 3.7 percent, new hiring will be required. Furthermore, with U.S. exports on the
rise, employment losses in manufacturing will be less of a drain on employment growth. Nonfarm
payrolls are expected to increase by 2.4 million over the course of 2000.
In 1999, payrolls grew by more than an estimated 2.7 million jobs. Low inflation together
with growing employment and incomes and gains in stock prices will keep consumer spending strong.
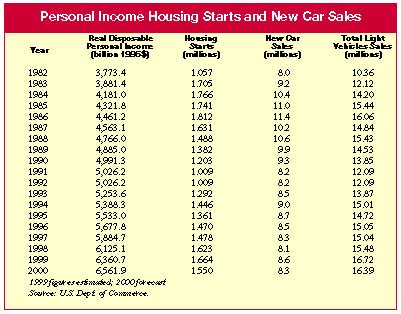
With short-term rates up by more than three-quarters of a percentage point, total sales of
new light vehicles are expected ease a bit to 16.4 million units this year from of 16.7 million in
1999.
This will be the fifth year in a row with total unit sales above 15 million and the second
consecutive year above 16 million. Also, the impact of higher mortgage rates on new home
construction will be mitigated by rising employment and increases in the stock market prices.
New construction will edge down to 1.55 million from 1.66 million in 1999.
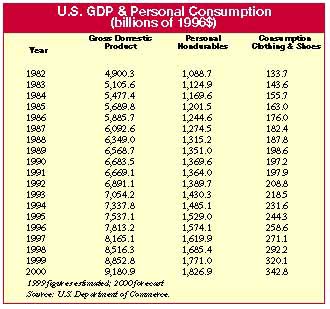
Consequently, growth of consumer spending on durable goods adjusted for inflation is
expected to grow 5.0 percent this year after rising at double-digit rates of 10.9 percent in 1999
and 11.3 percent in 1998.
Demand for non-durable goods rose 5.1 percent last year from 4.0 percent in 1998. Purchases
of clothing were up 9.6 percent in real terms, following a 7.8 percent gain in 1998.
With consumer confidence running high, healthy growth in employment and incomes, low prices
bode well for spending on new clothing. Expect purchases of clothing and shoes to grow by 7.1
percent in real terms. All in all, consumer spending will move up 3.8 percent in 2000, after
soaring 5.1 percent last year.
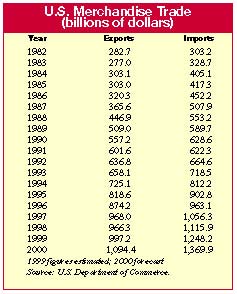
The trade deficit deteriorated rapidly last year, as our economy grew at a fast clip and
economic activity overseas was mediocre. Total U.S. exports in nominal terms averaged just 2.9
percent above the 1998 level, while they grew 3.6 percent in real terms, up from 2.2 percent in
1998, but sharply down from the trend growth of 10 percent in 1994-1997. Meanwhile, imports
continued to be a sore point for the United States even after factoring out the impact of the sharp
rise in oil prices. Strong domestic demand and a 3.7-percent decline of the dollar’s value against
most currencies in the world combined to push imports up 11.6 percent in real terms in 1999. In
current dollars, the merchandise trade deficit ballooned to an estimated $350 billion from $249
billion in 1998, while the surplus on services narrowed by $2.5 billion to $96.8 billion.
The appreciation from low values of the currencies in countries in Southeast Asia coupled
with strong economic activity will help U.S. exports to gain momentum this year. U.S. exports in
real terms, led by capital goods, are expected to grow 7.4 percent in 2000.
Conversely, our growth in imports is expected to slow down as U.S. economic activity
decelerates from 1999’s booming rate. The end result, however, would be a further deterioration in
net exports of goods and services in real terms. On the bright side, the trade slippage is expected
to narrow to $51 billion, down sharply from an estimated $106 billion in 1999. Nevertheless, this
will extend the period of rapidly rising merchandise deficits to nine years in a row.
The federal government surplus is expected to climb to $145 billion in the fiscal year 2000,
from $123 billion in 1999 and $69 billion in 1998. With surpluses for three years in a row after
running large deficits in nearly three decades, federal government spending adjusted for inflation
is expected to post a modest gain in 2000. This will be the second year in a row that government
spending grows, reversing real spending declines for eight consecutive years. Furthermore, with the
school age population rising, spending by local and state government is seen growing by 3.6 percent
in real terms.
Textiles Seeks Its Share
Prospects for U.S. producers of
fibers, textiles and apparel are not very promising for 2000.
Clothing prices except for 1997 have been on a downtrend since 1992 falling by 1.4 percent
per year. The sharp appreciation of the dollar versus the currencies of countries with large
apparel exports to the United States in the aftermath of the Asian crisis in 1997 has accelerated
the decline in clothing prices to 2.0 percent in the last two years. This in turn has contributed
in part to the strong demand for clothing in real terms.
In 2000, with employment and income on the rise, clothing sales will do well. Total outlays
for clothing and shoes are expected to grow 7.1 percent in volume and 5.7 percent in dollar terms.
Last year, spending on clothing and shoes surged 9.6 percent in volume and 7.4 percent in dollar
terms. Unfortunately, the trade deficit for apparel rose to an estimated $48.3 billion in 1999 from
$45.2 billion in 1998 and $40.0 billion in 1997. All the benefits of increased domestic demand for
apparel, however, accrued to foreign producers because output of apparel declined 6.7 percent last
year on top a loss of 5.3 percent in 1998.
Housing starts are projected to remain above the 1.5 million mark for the third year in a
row hovering around 1.55 million units in 2000, but down from 1.66 million in 1999 and 1.62 million
in 1998. Since it takes six to nine months for the competition of homes, last year’s increase in
housing starts means that the number of owners of newly built homes will be virtually flat in 2000.
With personal income on the rise, sales of home furnishings are expected to increase. Sales of
existing homes, after reaching a historical high of 5.17 million units last year, are expected to
ease to 4.85 million. This will be the fifth year in a row that sales remained above the
4.0-million mark This high level of turnover in existing homes is a positive factor for sales of
textile home furnishings and other interior furnishings due to remodeling and redecoration. Bed and
bath wares will participate in kind.
Since U.S. industrial output is expected to strengthen this year, industrial fibers and
textiles will end up in the plus column. Moreover, the creation of more than 2.7 million jobs in
1999 reduced the vacancy rate. The addition of 2.4 million new jobs in 2000 bodes well for
additional demand for office space and a small improvement in new construction. In 2000, investment
in nonresidential buildings is expected to grow by about 2.0 percent in real terms, after remaining
flat in 1999 and rising by 5.3 percent in 1998. With after tax corporate profits still up by 8.5
percent in 2000, growth in business spending on carpeting and furnishings will benefit.
Demand for U.S.-made fibers, textiles
and apparel will see a small improvement in 2000. Exports will make a minor contribution to growth
as economic activity overseas improves, while imports will continue to gain ground resulting in
further deterioration in the trade gap.
Despite a gain in economic activity, production of domestic apparel and products is expected
to decline in 2000 for the fifth year in a row. In 1999, output was down an estimated 6.7 percent,
after falling 5.3 percent in 1998. This is more than twice the decline of 2.3 percent in the prior
two years and an indication of the effects of the currency devaluation in the aftermath of the
Asian crisis. This means that U.S. apparel production deterioration is likely to persist in 2000.
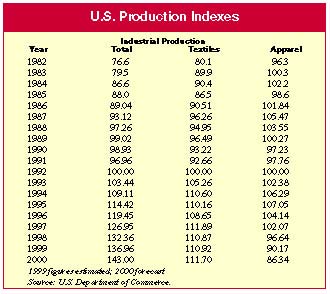
Textile production is expected to increase 0.7 percent this year, after being flat in 1999 and
coming down 0.9 percent in 1998.
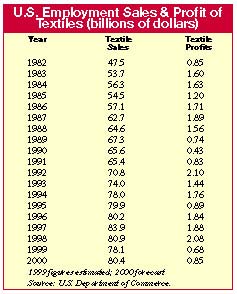
Shipments by textile producers are expected to move up to $79.4 billion from an estimated
$78.0 billion in 1999 and $80.9 billion in 1998.
In a low inflation period and still a strong dollar, wholesale textile and apparel prices
are likely to remain essentially flat after coming down 1.7 percent in 1999. The outlook for the
industry’s payrolls is for a 4.5-percent drop, down for the sixth year in a row. Last year,
payrolls declined 5.8 percent and have declined by 112,800 jobs since 1994. Expect employment to
average 538 thousand jobs in 2000, down more than fifteen thousand jobs from last year. Finally,
hourly wages will rise 3.0 percent in 2000.
In a cutthroat environment the industry must continue to invest heavily in replacing
noncompetitive capacity and in increasing efficiency in order to defend domestic markets from
rising foreign competition. In 1999, growth for textile exports slowed down to a meager gain of
$0.2 billion, while for imports rose by $0.7 billion, lifting the textiles net trade deficit for
1999 to $4.4 billion from $3.9 billion in 1998 and only $3.0 billion in 1997. Clearly, the sharp
appreciation of the dollar in the aftermath of the Asian crisis is part of the blame. While the
industry is to a large extent insulated from foreign competition due to its capital intensity, the
trade deterioration in the last three years is not likely to go away in the near future.
Moreover, in a low-inflation environment and squeezed profit margins rationalization is
unavoidable. With the industry’s operating rate expected to improve slightly to 84.7 percent from
84.3 percent in 1999 and 84.4 percent in 1998, this year’s textile spending on plant and equipment
will remain essentially at last year’s level.
Made In The U.S.A.
Demand for U.S.-made fibers, textiles
and apparel will see a small improvement in 2000. Exports will make a minor contribution to growth
as economic activity overseas improves, while imports will continue to gain ground resulting in
further deterioration in the trade gap.
Despite a gain in economic activity, production of domestic apparel and products is expected
to decline in 2000 for the fifth year in a row. In 1999, output was down an estimated 6.7 percent,
after falling 5.3 percent in 1998. This is more than twice the decline of 2.3 percent in the prior
two years and an indication of the effects of the currency devaluation in the aftermath of the
Asian crisis. This means that U.S. apparel production deterioration is likely to persist in 2000.
Textile production is expected to increase 0.7 percent this year, after being flat in 1999 and
coming down 0.9 percent in 1998.
Shipments by textile producers are expected to move up to $79.4 billion from an estimated
$78.0 billion in 1999 and $80.9 billion in 1998.
In a low inflation period and still a strong dollar, wholesale textile and apparel prices
are likely to remain essentially flat after coming down 1.7 percent in 1999. The outlook for the
industry’s payrolls is for a 4.5-percent drop, down for the sixth year in a row. Last year,
payrolls declined 5.8 percent and have declined by 112,800 jobs since 1994. Expect employment to
average 538 thousand jobs in 2000, down more than fifteen thousand jobs from last year. Finally,
hourly wages will rise 3.0 percent in 2000.
In a cutthroat environment the industry must continue to invest heavily in replacing
noncompetitive capacity and in increasing efficiency in order to defend domestic markets from
rising foreign competition. In 1999, growth for textile exports slowed down to a meager gain of
$0.2 billion, while for imports rose by $0.7 billion, lifting the textiles net trade deficit for
1999 to $4.4 billion from $3.9 billion in 1998 and only $3.0 billion in 1997. Clearly, the sharp
appreciation of the dollar in the aftermath of the Asian crisis is part of the blame. While the
industry is to a large extent insulated from foreign competition due to its capital intensity, the
trade deterioration in the last three years is not likely to go away in the near future.
Moreover, in a low-inflation environment and squeezed profit margins rationalization is
unavoidable. With the industry’s operating rate expected to improve slightly to 84.7 percent from
84.3 percent in 1999 and 84.4 percent in 1998, this year’s textile spending on plant and equipment
will remain essentially at last year’s level.
Risks To The Forecast
A major risk to our economic outlook
is the uncertainty stemming from the possibility of higher oil prices and inflation, which in turn
would translate into higher interest rates.
While an increase in oil prices will benefit the economies of the oil-producing countries,
it poses a threat to the recovery of the Asian economies and it would prolong the economic problems
in the region and deal another blow to U.S. exports. In this case, even though the risk of a
recession is low, economic growth will be in the 2.8-percent to 3.2-percent range in 2000.
On the bright side, if oil prices subside and fall below the $20 per barrel mark there will
be no need for Federal Reserve to raise rate any more. In this case, the U.S. economy is likely to
grow by at least 4.0 percent.
January 2000
 T
T
 O
O
 While
While China
China S
S When
When According
 The
The Across
 To
To