O
ver the past several years,
Textile World
has spent considerable time and ink tracing the increasing textile industry activities among
the nations of Southeast Asia. The time now is appropriate to delve into early signals of new
direction from the United States manufactured fiber industry as it faces a series of events:
continued growth from and shifting among international competitors; new management among several
major domestic players; and the World Trade Organization (WTO) finally ending import quotas. The
industry has had several years to adjust to these stimuli, and
TW
will explore several data sets which suggest industry direction and readiness.
TW
long ago advocated that the industry increase development and innovation, with particular
emphasis on changing fiber and fabric outputs from apparel to home fashions and industrial
end-uses. In May 2004,
TW
postulated that, somewhat contrary to industry claims, the recent record of textile-related
patent filings suggested a falloff in development
(See Efficiency Versus Effectiveness, TW, May 2004). What the industry viewed as product
and process innovation,
TW
viewed as efficiency improvement. Efficiency/productivity is vital, but a proper business
model, such as one that effectively uses investment dollars, is the key to long-term survival.
Long-term is here; crunch time is at hand; the 800-pound gorilla is about to be released from the
WTO cage; and the world will find out if and how innovatively the industry addressed change.
Apparel
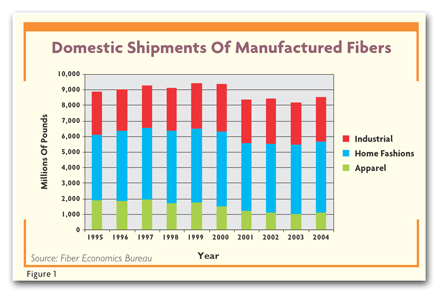
Figure 1 graphs domestic manufactured fiber shipments as recorded by the Fiber Economics Bureau
(FEB) from 1995 through the author’s estimated 2004 finish. Several data points stand out.
First, and quite unsurprisingly, poundage of fibers destined for apparel use dropped
significantly through the period. As has been reported all too often, multiple mill closings bear
testament to this trend. Fine-denier filament materials bore the brunt of this slide, dropping by
50 percent from 1 billion pounds of filament in 1995 to slightly more than 500 million pounds by
the end of 2004. Staple materials, primarily polyester, fell only 31 percent during the same time.
This disparity fits uniquely into the pattern of fiber production facilities erected in Asia that
focus primarily on filament polyester.
Industrial Fabrics
Fiber use in industrial fabrics as reported by the FEB stagnated through the period. (Authors
note: The FEB reports more than half of all staple fiber sales to the nonwovens industry as
industrial sales unallocated nonwovens, which means the FEB cant decide precisely where the fiber
fits and, in its analysis of primary end-uses, does not count meltblown and slit-film produced
materials. Portions of these shipments wind up in home fashions and apparel, but for purposes of
this article, they will be counted as industrial product.) If one remembers that much of the
industrial market area is specification-driven, one must conclude that, with as much warning as the
industry has had, improvements in shipments should be showing up.
Such is almost, but not quite, the case. In 1995, total fiber sales to industrial markets
totaled 2.7 billion pounds. The same markets absorbed 2.8 billion pounds in 2004 – hardly a growth
market. If we deduct fiber sales to the obvious sub-markets of the rubber industry and fiberfill,
the former of which has shrunk from 400 million to 300 million pounds in the period as
longer-mileage tires are produced and the latter of which is stagnant at approximately 425 million
pounds, the remaining industrial markets absorbed 1.9 billion pounds in 1995 and will grow to
slightly more than 2 billion pounds in 2004, effectively offsetting the losses in tires.
Preliminary examination of many end-use consumption patterns does not show a significant rise in
any major market segment; it appears that a multitude of smaller, more specialized end-uses
currently is developing. The smaller uses those in which one cannot identify substantive growth in
the FEB figures include abrasive fabrics, luggage materials, wipes, wallcovering fabrics, carrier
fibers, mops, bale wrap, civil engineering fabrics and a group of yet smaller end-uses. These areas
are in the right direction is it soon enough to withstand the WTO’s 2005?
A Metaphor For US Textiles
Home fashions has long been viewed as a logical equipment-complementary safe harbor for fiber
companies and mills beset by inexpensive apparel imports. The economics, timing and physical size
of many made-up home furnishings articles tend to beg against import competition. China currently
is delivering upholstered furniture against short order cycles. In the longer term,
TW
believes economics will force China to abate as a serious competitor. In strict terms, home
fashions comprises a lot of carpet plus a little of a lot of other manufactured goods including
spreads, blankets, sheets and bedding, towels, curtains and drapes, upholstery, napery and
screening; and a host of small-volume, miscellaneous products. Cotton is king in home fashions,
representing approximately 55 percent of total fiber consumption, while several manufactured fibers
maintain important roles in the market. Sheets and bedding, plus spreads and quilts, use
considerable pounds of polyester staple in an average consumption of 33-percent
polyester/67-percent cotton; curtains and drapes use polyester in an average consumption of
25-percent polyester/75-percent cotton; and upholstery relies on combinations of nylon and
polyester filament, polyester and cotton staple, and olefin staple and filament.
Unfortunately, the non-carpet home fashions market is dwarfed by fiber consumption for the
manufacture of carpets. The carpet industry consumed increasing amounts of all manufactured fibers
through the period discussed. In the inventory-adjustment-driven year of 2001, carpet fiber
consumption dropped 10 percent. The still-strong, low interest rate-driven housing market responded
and drove carpet fiber sales back from the 2001 loss, and sales have returned powerfully to the
2000 level. Carpet industry fiber consumption has grown at a compounded annual rate of almost 1.5
percent – not bad in an economy that struggled through an almost-choking two-plus-year
recession.
TW
received an analytical surprise in examining home fashions. Because the major portion
(greater than 75 percent for the period and generally above 80 percent) of home fashions fibers
goes into carpet,
TW has always tracked housing starts as a proxy for home fashions consumption. A
number of years ago, a model was built correlating carpet and non-carpet home fashions fiber sales
with new housing starts. The correlation was not perfect, but it withstood the rigors of serious
investigation through several major business expansions and recessions. Two statistics extracted
from that model are useful here in exploring growth possibilities in the home. Mac-Mansion is a
metaphor for the increasing size of new-construction housing in the past decade. Several sources
cite data announcing the average house covered 2,225 square feet in 1999, growing approximately 1.6
percent to 2,260 square feet a year later with few signs of abatement. The 2000 number is
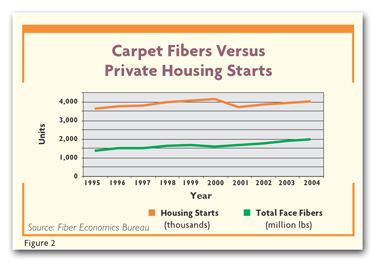
approximately 50 percent above 1970 measurements. Figure 2 graphs housing starts against carpet
fiber consumption. The difference in slopes of the two curves shows that at the current rate,
without some incentive, consumers will not buy carpet at the same rate as they are adding to
housing stock.
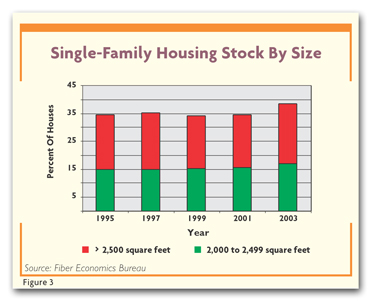
Interior space is addressed in Figure 3, which demonstrates changes in living space in the
country’s housing stock. Specifically, Figure 3 shows that in 1995, 35 percent of the nation’s
single-family housing stock contained at least 2,000 square feet. By 2003, the level had risen to
approximately 38 percent, with most of the growth in houses containing at least 2,500 square feet.
Combine this space growth with a 3.7-percent compounded annual rate of growth for new housing
starts and housing starts are up; average area is up; and total floor space is up and fiber
consumption is static.
Is something wrong here? Some regressive pressure accrues from reported greater use of hardwood
floors, and some probably is created by lighter carpet constructions that take advantage of
improved fiber quality and longevity now available from manufacturers. What appears to be missing
is a studious approach to the consumer promoting the advantages of carpet in the home. These
questions begged to be asked: How many bedrooms are carpeted? Is the new family room carpeted?
Basement, hall, den?
Further, domestic fiber consumption in non-carpet products has slipped by almost 25 percent
during the period. Don’t these new homes have additional bedrooms? Don’t the buyers need a place to
sit? Why have we lost the edge in marketing home fashions, where location/logistics can play an
important role in expanding domestic consumption?
Imports obviously play a role, as does the recent trend to leather in upholstery. Anecdotally, a
recent order to delivery of a new fabric-covered sofa took seven months. Today’s consumer is
looking for instant gratification, and so viable business models must include customer response and
service and also include consumer education about the timing and styling advantages of domestic,
fiber and fabric-containing home fashions.
Innovation is not limited to product. Consumers have products and technology, and probably face
limited product and technology improvements. What is needed now is a shorter, more responsive
distribution channel. Start by reducing the seven-month order cycle.
January 2005


