TEMPE, Ariz. — December 13, 2021 — Economic improvement in the United States will continue in 2022, say the nation’s purchasing and supply management executives in the December 2021 Semiannual Economic Forecast. This expansion will continue a growth trend that began in June 2020, as indicated in the monthly ISM® Report On Business®. Revenues are expected to increase in 15 of 18 manufacturing industries and 17 of 18 services-sector industries. Capital expenditures are expected to increase by 7.7 percent in the manufacturing sector (after a 12.1-percent increase in 2021) and increase by 10.3 percent in the services sector. The manufacturing employment base is expected to grow by 1 percent following an increase of 3.3 percent in 2021. Compared to the first half (H1), growth in the second half (H2) of the year is projected to cool slightly in manufacturing and accelerate in services.
These projections are part of the forecast issued by the Business Survey Committee of Institute for Supply Management® (ISM®). The forecast was released today by Timothy R. Fiore, CPSM, C.P.M, Chair of the ISM Manufacturing Business Survey Committee, and by Anthony S. Nieves, CPSM, C.P.M., A.P.P, CFPM, Chair of the ISM Services Business Survey Committee.
Manufacturing Summary
Expectations for 2022 are positive, as 65 percent of survey respondents expect revenues to be greater in 2022 than in 2021. The panel of purchasing and supply executives expects a 6.5-percent net increase in overall revenues for 2022, compared to a 14.1-percent increase reported for 2021. Fifteen of the 18 manufacturing industries expect revenue improvement in 2022, listed in order of largest to smallest projected increase: Apparel, Leather & Allied Products; Machinery; Computer & Electronic Products; Fabricated Metal Products; Transportation Equipment; Primary Metals; Miscellaneous Manufacturing; Chemical Products; Furniture & Related Products; Food, Beverage & Tobacco Products; Electrical Equipment, Appliances & Components; Petroleum & Coal Products; Printing & Related Support Activities; Nonmetallic Mineral Products; and Paper Products.
“Manufacturing’s purchasing and supply executives expect to see strong growth in 2022. They are optimistic about overall business prospects for the first half of 2022, with business continuing to expand through the second half, though at slightly lower rates. Manufacturing experienced 18 consecutive months of growth from June 2020 through November 2021, with the composite PMI® registering above 60 in nine of the last 12 months of that time frame. Respondents expect raw materials pricing pressure to increase in 2022, as well as improved profit margins over H2 2021. Wages and employment will continue high rates of growth as hiring slows. Manufacturers also predict growth in both exports and imports in 2022,” says Fiore.
In the manufacturing sector, respondents report operating at 88.7 percent of their normal capacity, up 0.4 percentage point from the 88.3 percent reported in May 2021. Purchasing and supply executives predict that capital expenditures will increase by 7.7 percent in 2022 over 2021, compared to the 12.1-percent increase reported for 2021 over 2020. Manufacturers expect employment in the sector to grow by 1 percent in 2022 relative to December 2021 levels, while labor and benefit costs are expected to increase an average of 4.7 percent. Respondents also expect the U.S. dollar to weaken against six of the seven currencies of major trading partners in 2022; it is expected to strengthen relative to the Mexican peso.
The panel predicts that prices paid for raw materials will increase 8.2 percent during the first five months of the year, with an overall increase of 8.1 percent for 2022. This compares to a reported 14.5 percent increase in raw materials prices between the end of 2020 and November of 2021.
Services Summary
Fifty-four percent of services supply management executives expect their 2022 revenues to be higher than in 2021. They expect a 4.3 percent net increase in overall revenues for 2022 compared to a 4.8-percent increase reported for 2021. The 17 industries expecting revenue increases in 2022 — listed in order of largest to smallest projected increase— are: Mining; Accommodation & Food Services; Information; Arts, Entertainment & Recreation; Finance & Insurance; Wholesale Trade; Management of Companies & Support Services; Agriculture, Forestry, Fishing & Hunting; Construction; Utilities; Professional, Scientific & Technical Services; Other Services; Retail Trade; Public Administration; Transportation & Warehousing; Educational Services; and Health Care & Social Assistance.
“Services supply executives report operating at 89.4 percent of their normal capacity, the same as the 89.4 percent reported in May 2021. They are optimistic about continued growth in the first half of 2022 and more growth for the second half, with a projected increase in growth rate for capital reinvestment. They forecast that their capacity to produce products and provide services will rise by 3.3 percent during 2022, and capital expenditures will increase by 10.3 percent. Services panel members also predict their overall employment will increase by 1 percent during 2022,” says Nieves.
Respondents in services industries expect the prices they pay for materials and services to increase by 8.9 percent during 2022. They also forecast that their overall labor and benefit costs will increase 6.1 percent. Profit margin decreases were reported in the second and third quarters of 2021, but respondents expect them to increase between now and May 2022.
OPERATING RATE
Manufacturing
Manufacturing purchasing and supply executives report their companies are currently operating at 88.7 percent of normal capacity. This is a 0.4-percentage point increase when compared to May 2021 (88.3 percent) and an increase when compared to December 2020 (85.7 percent). The following 13 industries — listed in order — are operating at or above the average rate of 88.7 percent: Wood Products; Petroleum & Coal Products; Furniture & Related Products; Apparel, Leather & Allied Products; Printing & Related Support Activities; Miscellaneous Manufacturing; Chemical Products; Computer & Electronic Products; Electrical Equipment, Appliances & Components; Textile Mills; Paper Products; Machinery; and Nonmetallic Mineral Products.
Services
Services supply executives report their organizations are currently operating at 89.4 percent of normal capacity. This the same number reported in May 2021 and higher than the 86.6 percent reported in December 2020. The 10 industries operating at or above the average capacity level of 89.4 percent — listed in order — are: Finance & Insurance; Arts, Entertainment & Recreation; Public Administration; Educational Services; Health Care & Social Assistance; Utilities; Accommodation & Food Services; Construction; Retail Trade; and Mining.
| Operating Rate |
|
Manufacturing |
Services |
|
Dec
2020 |
May
2021 |
Dec
2021 |
Dec
2020 |
May
2021 |
Dec
2021 |
| 90%+ |
52% |
56% |
60% |
59% |
65% |
63% |
| 50%-89% |
44% |
43% |
39% |
37% |
34% |
36% |
| Below 50% |
4% |
1% |
1% |
4% |
1% |
1% |
| Est. Overall Average |
85.7% |
88.3% |
88.7% |
86.6% |
89.4% |
89.4% |
PRODUCTION CAPACITY
Manufacturing
Production capacity in manufacturing increased 3.5 percentage points in 2021, as 38 percent of purchasing and supply executives reported an average capacity increase of 14.4 percent, 13 percent reported an average decrease of 14.9 percent, and 49 percent reported no change. This compares to a May 2021 predicted increase in production capacity of 6.6 percent for 2021. Expectations for 2022 are for an increase of 6.8 percent. The 15 industries that expect an increase in production capacity in 2022 — listed in order — are: Apparel, Leather & Allied Products; Electrical Equipment, Appliances & Components; Fabricated Metal Products; Nonmetallic Mineral Products; Paper Products; Chemical Products; Machinery; Computer & Electronic Products; Food, Beverage & Tobacco Products; Transportation Equipment; Furniture & Related Products; Primary Metals; Plastics & Rubber Products; Miscellaneous Manufacturing; and Petroleum & Coal Products.
| Manufacturing Production Capacity |
|
Predicted For 2021 |
Reported For 2021 |
Predicted For 2022 |
|
Predicted
May 2021 |
Magnitude
of Change |
Reported
Dec 2021 |
Magnitude
of Change |
Predicted
Dec 2021 |
Magnitude
of Change |
| Higher |
44% |
+16.8% |
38% |
+14.4 |
51% |
+14.6 |
| Same |
51% |
NA |
49% |
NA |
43% |
NA |
| Lower |
5% |
-17.3% |
13% |
-14.9 |
6% |
-12.8 |
| Net Average |
|
+6.6% |
|
+3.5% |
|
+6.8% |
The principal means of achieving increases in production capacity in 2021 were (in order of importance):
1) Additional personnel
2) More hours worked with existing personnel
3) Additional plant and/or equipment
4) Fewer shutdowns.
Services
The capacity to produce products or provide services in the services sector increased 2.3 percent during 2021. This is the same as what was predicted in May of 2021 and 1 percentage point lower than the 3.3 percent predicted for 2022. For 2022, 34 percent of services supply managers expect increases averaging 13.3 percent, and 9 percent of respondents expect decreases averaging 13.7 percent. Fifty-seven percent expect no change in capacity. The 15 industries expecting increases in capacity in 2022 — listed in order — are: Mining; Accommodation & Food Services; Arts, Entertainment & Recreation; Finance & Insurance; Professional, Scientific & Technical Services; Other Services; Wholesale Trade; Information; Health Care & Social Assistance; Educational Services; Educational Services; Public Administration; Retail Trade; Transportation & Warehousing; Utilities; and Construction.
| Services Production or Provision Capacity |
|
Predicted For 2021 |
Reported For 2021 |
Predicted For 2022 |
|
Predicted
May 2021 |
Magnitude
of Change |
Reported
Dec 2021 |
Magnitude
of Change |
Predicted
Dec 2021 |
Magnitude
of Change |
| Higher |
28% |
+11.6% |
21% |
+27.9% |
34% |
+13.3% |
| Same |
68% |
NA |
62% |
NA |
57% |
NA |
| Lower |
4% |
-24.2% |
17% |
-22.1% |
9% |
-13.7% |
| Net Average |
|
+2.3% |
|
+2.3% |
|
+3.3% |
The principal means of achieving increases in production or provision capacity in 2021 were (in order of importance):
1) Additional personnel (permanent, temporary or contract)
2) More hours worked with existing personnel
3) Additional plant and/or equipment
4) More shifts worked with existing personnel.
CAPITAL EXPENDITURES — 2021 vs. 2020
Manufacturing
Purchasing and supply executives report 2021 capital expenditures increased 12.1 percent on average when compared to 2020 levels. Expenditures for 2021 beat survey respondents’ previous expectations, as they predicted an increase of 8.7 percent for 2021 in May 2021. The 42 percent of purchasers who reported increased capital expenditures in 2021 indicated an average increase of 37.8 percent, while the 12 percent who said their capital spending was reduced reported an average decrease of 29.3 percent. Forty-six percent of respondents said their levels of spend were unchanged in 2021. The 15 industries showing increases in capital expenditures for 2021 — listed in order of percentage increase — are: Nonmetallic Mineral Products; Computer & Electronic Products; Transportation Equipment; Machinery; Wood Products; Fabricated Metal Products; Apparel, Leather & Allied Products; Electrical Equipment, Appliances & Components; Chemical Products; Petroleum & Coal Products; Printing & Related Support Activities; Miscellaneous Manufacturing; Food, Beverage & Tobacco Products; Furniture & Related Products; and Paper Products.
Services
Services supply management executives report their level of capital expenditures in 2021 increased 15.2 percent compared to 2020. This is quite a turnaround from the 4-percent decrease reported for 2020 and tops the 5.7-percent increase predicted by respondents in May 2021. Fifty-two percent report increases averaging 33.5 percent, while 12 percent report decreases averaging 19.3 percent. Thirty-six percent indicate they spent the same on capital expenditures in 2021 as in 2020. The 15 industries experiencing increases in capital expenditures in 2021 — listed in order of percentage increase — are: Real Estate, Rental & Leasing; Mining; Accommodation & Food Services; Retail Trade; Utilities; Wholesale Trade; Transportation & Warehousing; Construction; Information; Professional, Scientific & Technical Services; Finance & Insurance; Educational Services; Public Administration; Health Care & Social Assistance; and Management of Companies & Support Services.
| Capital Expenditures 2021 vs. 2020 |
|
Manufacturing |
Services |
|
Predicted
May 2021 |
Reported
Dec 2021 |
Magnitude
of Change |
Predicted
May 2021 |
Reported
Dec 2021 |
Magnitude
of Change |
| Higher |
27% |
42% |
+37.8% |
31% |
52% |
+33.5% |
| Same |
57% |
46% |
NA |
58% |
36% |
NA |
| Lower |
16% |
12% |
-29.3% |
11% |
12% |
-19.3% |
| Net Average |
+8.7% |
|
+12.1% |
+5.7% |
|
+15.2% |
PREDICTED CAPITAL EXPENDITURES — 2022 vs. 2021
Manufacturing
Purchasing and supply executives expect capital expenditures to increase 7.7 percent in 2022. The 40 percent of respondents who predict increased capital expenditures in 2022 indicate an average increase of 27.1 percent, while the 11 percent who said their capital spending would be reduced predict an average decrease of 31.2 percent. The remaining 49 percent said they expect to spend the same in 2022 as in 2021. The four industries predicting increases in capital expenditures, at or above the average increase of 7.7 percent for 2022 are: Paper Products; Electrical Equipment, Appliances & Components; Apparel, Leather & Allied Products; and Wood Products.
Services
Services purchasing and supply executives are expecting an increase of 10.3 percent in capital expenditures in 2022, less than the 15.2 percent increase reported for 2021. The 55 percent of respondents expecting to spend more on capital expenditures predict an average increase of 23.7 percent. An additional 10 percent anticipate a decrease averaging 25.6 percent. Thirty-five percent expect to spend the same on capital expenditures in 2022 as in 2021. The 13 industries expecting increases in capital expenditures in 2022 — listed in order of percentage increase — are: Mining; Retail Trade; Arts, Entertainment & Recreation; Utilities; Real Estate, Rental & Leasing; Accommodation & Food Services; Wholesale Trade; Educational Services; Public Administration; Information; Health Care & Social Assistance; Management of Companies & Support Services; and Finance & Insurance.
| Predicted Capital Expenditures 2022 vs. 2021 |
|
|
Manufacturing |
Services |
|
Predicted
Dec 2021 |
Magnitude
of Change |
Predicted
Dec 2021 |
Magnitude
of Change |
| Higher |
40% |
+27.1% |
55% |
+23.7% |
| Same |
49% |
NA |
35% |
NA |
| Lower |
11% |
-31.2% |
10% |
-25.6% |
| Net Average |
|
+7.7% |
|
+10.3% |
|
|
|
|
|
|
PRICES — Changes Between End of 2020 and End of 2021
Manufacturing
After an earlier forecast in May 2021 of an 8.1 percent increase in prices paid for raw materials in 2021, survey respondents report price increases averaging 14.5 percent for the year. The 89 percent who say their prices are higher now than at the end of 2020 report an average increase of 16.5 percent, while the 1 percent who report lower prices averaged a 4-percent decrease. The remaining 10 percent indicate no change in 2021. The eight industries experiencing price increases above the average of 14.5 percent in 2021 — listed in order — are: Apparel, Leather & Allied Products; Fabricated Metal Products; Nonmetallic Mineral Products; Machinery; Primary Metals; Wood Products; Textile Mills; and Electrical Equipment, Appliances & Components.
| Manufacturing Price Changes Between End of 2020 and End of 2021 |
|
Predicted
Dec 2020 |
Magnitude
of Change |
Predicted
May 2021 |
Magnitude
of Change |
Reported
Dec 2021 |
Magnitude
of Change |
| Higher |
57% |
+6.9% |
74% |
+11.1% |
89% |
+16.5% |
| Same |
27% |
NA |
23% |
NA |
10% |
NA |
| Lower |
16% |
-6.3% |
3% |
-3.7% |
1% |
-4.0% |
| Net Average |
|
+2.9% |
|
+8.1% |
|
+14.5% |
Services
In 2021, services supply executives report, prices paid increased by 10.4 percent. This is more than the 4.9-percent increase they predicted in May 2021, and also more than the 3.5-percent increase for 2021 predicted one year ago. Eighty-six percent of respondents report price increases averaging 12.1 percent. Only 1 percent of purchasers indicate decreased prices, with an average reduction of 11.3 percent, and 13 percent of respondents did not experience price changes this year. The 18 industries reporting prices increases for 2021 — listed in order — are: Accommodation & Food Services; Retail Trade; Wholesale Trade; Utilities; Public Administration; Construction; Transportation & Warehousing; Health Care & Social Assistance; Management of Companies & Support Services; Professional, Scientific & Technical Services; Educational Services; Real Estate, Rental & Leasing; Arts, Entertainment & Recreation; Mining; Information; Finance & Insurance; Other Services; and Agriculture, Forestry, Fishing & Hunting.
| Services Price Changes Between End of 2020 and End of 2021 |
|
Predicted
Dec 2020 |
Magnitude
of Change |
Predicted
May 2021 |
Magnitude
of Change |
Reported
Dec 2021 |
Magnitude
of Change |
| Higher |
57% |
+7.5% |
63% |
+8.3% |
86% |
+12.1% |
| Same |
36% |
NA |
34% |
NA |
13% |
NA |
| Lower |
7% |
-12.2% |
3% |
-12.0% |
1% |
-11.3% |
| Net Average |
|
+3.5% |
|
+4.9% |
|
+10.4% |
PRICES – Predicted Changes Between End of 2021 and May 2022
Manufacturing
Eighty-one percent of purchasing and supply executives expect the prices they pay to increase in early 2022 by an average of 10.6 percent. At the same time, four percent anticipate decreases averaging 12.2 percent. Including the 15 percent who expect no change in prices in the first five months of 2022, purchasers expect a net average overall price increase of 8.2 percent. The eight industries predicting a higher than 8.2 percent average increase in prices paid in the first part of 2022 — listed in order — are: Apparel, Leather & Allied Products; Textile Mills; Electrical Equipment, Appliances & Components; Paper Products; Food, Beverage & Tobacco Products; Nonmetallic Mineral Products; Miscellaneous Manufacturing; and Chemical Products.
Services
Services survey respondents predict their purchases in the first five months of 2022 will cost an average of 8.9 percent more than at the end of 2021. This is less than the increase reported for calendar year 2021. Eighty-six percent of services respondents predict the prices they pay will increase an average of 10.5 percent in the first part of 2022. Two percent of respondents expect price decreases averaging 5.8 percent. The remaining 12 percent predict no change in prices in the first five months of 2022. The nine industries predicting price increases of at least 8.9 percent on average in the first part of 2022 — listed in order of percentage increase — are: Accommodation & Food Services; Retail Trade; Public Administration; Utilities; Arts, Entertainment & Recreation; Real Estate, Rental & Leasing; Transportation & Warehousing; Wholesale Trade; and Other Services.
| Prices – Predicted Changes Between End of 2021 and May 2022 |
|
Manufacturing |
Services |
|
Predicted
Dec 2021 |
Magnitude
of Change |
Predicted
Dec 2021 |
Magnitude
of Change |
| Higher |
81% |
+10.6% |
86% |
+10.5% |
| Same |
15% |
NA |
12% |
NA |
| Lower |
4% |
-12.2% |
2% |
-5.8% |
| Net Average |
|
+8.2% |
|
+8.9% |
|
|
|
|
|
|
|
|
|
|
|
|
PRICES — Predicted Changes Between End of 2021 and End of 2022
Manufacturing
Respondents predict a net average increase in prices paid of 8.1 percent between December 2021 and December 2022. Seventy-seven percent of respondents expect an average price increase of 12.1 percent for the full year of 2022, while 11 percent expect an average reduction of 11.3 percent. The remaining 12 percent expect no change in their average prices paid for the year 2022. The nine industries expecting price increases above the predicted average of 8.1 percent by the end of 2022 — listed in order — are: Apparel, Leather & Allied Products; Electrical Equipment, Appliances & Components; Paper Products; Textile Mills; Nonmetallic Mineral Products; Food, Beverage & Tobacco Products; Furniture & Related Products; Transportation Equipment; and Chemical Products.
Services
For all of 2022, services supply management executives expect their prices to increase an average of 9.2 percent. Eighty-four percent of respondents expect increases averaging 11.3 percent, 4 percent anticipate prices to drop an average of 6.4 percent, and 12 percent foresee no change in prices during the next year. The eight industries expecting greater than the 9.2-percent average price increase by the end of 2022 — listed in order of percentage increase — are: Accommodation & Food Services; Retail Trade; Public Administration; Other Services; Arts, Entertainment & Recreation; Utilities; Real Estate, Rental & Leasing; and Health Care & Social Assistance.
| Predicted Price Changes Between End of 2021 and End of 2022 |
|
Manufacturing |
Services |
|
Predicted
Dec 2021 |
Magnitude
of Change |
Predicted
Dec 2021 |
Magnitude
of Change |
| Higher |
77% |
+12.1 |
84% |
+11.3% |
| Same |
12% |
NA |
12% |
NA |
| Lower |
11% |
-11.3% |
4% |
-6.4% |
| Net Average |
|
+8.1% |
|
+9.2% |
|
|
|
|
|
|
|
|
|
|
|
|
LABOR AND BENEFIT COSTS — Predicted Rate Change End of 2021 vs. End of 2022
Manufacturing
Purchasing and supply executives expect higher overall labor and benefit costs for 2022. Seventy-three percent of respondents expect labor and benefit costs to grow by an average of 6.7 percent for all of 2022, while the 2 percent forecasting lower costs see them decreasing by an average of 10 percent. Including the 25 percent of respondents who believe costs will remain the same, the overall net rate of increase is expected to be 4.7 percent for the year. The 10 industries expecting to pay an increase of 4.7 percent or greater — listed in order of percentage increase — are: Furniture & Related Products; Electrical Equipment, Appliances & Components; Plastics & Rubber Products; Primary Metals; Machinery; Food, Beverage & Tobacco Products; Transportation Equipment; Fabricated Metal Products; Apparel, Leather & Allied Products; and Wood Products.
Services
Services purchasing and supply executives expect a 6.1-percent increase in labor and benefit costs in 2022. Seventy-two percent of respondents expect such costs to increase by an average of 8.9 percent. Another 3 percent of respondents expect labor and benefit costs to shrink by an average of 10.2 percent, and 25 percent believe costs will remain stable during 2022. The eight industries expecting to pay an increase of 6.1 percent or higher — listed in order of percentage increase — are: Real Estate, Rental & Leasing; Accommodation & Food Services; Retail Trade; Health Care & Social Assistance; Finance & Insurance; Agriculture, Forestry, Fishing & Hunting; Arts, Entertainment & Recreation; and Wholesale Trade.
| Labor and Benefit Costs — Predicted Rate Change End of 2021 vs. End of 2022 |
|
Manufacturing |
Services |
|
Predicted for
2021Dec 2020 |
Predicted for
2022Dec 2021 |
Magnitude
of Change |
Predicted for
2021Dec 2020 |
Predicted for
2022Dec 2021 |
Magnitude
of Change |
| Higher |
52% |
73% |
+6.7% |
43% |
72% |
+8.9% |
| Same |
44% |
25% |
NA |
54% |
25% |
NA |
| Lower |
4% |
2% |
-10.0% |
3% |
3% |
-10.2% |
| Net Average |
+2.7% |
|
+4.7% |
+2.2% |
|
+6.1% |
EMPLOYMENT — Change in Overall Employment
Manufacturing
ISM’s Manufacturing Business Survey Committee members report that sector employment increased 3.3 percent in 2021 and forecast that employment will increase by 1 percent, on average, for the full year of 2022. Thirty-six percent of respondents expect employment to be, on average, 10.3 percent higher in 2022, while 24 percent predict employment to be lower by an average of 11.2 percent. The remaining 40 percent of respondents expect their employment levels to be unchanged in 2022. The 14 industries predicting increases in employment in 2022 — listed in order — are: Apparel, Leather & Allied Products; Fabricated Metal Products; Nonmetallic Mineral Products; Electrical Equipment, Appliances & Components; Machinery; Furniture & Related Products; Computer & Electronic Products; Food, Beverage & Tobacco Products; Paper Products; Primary Metals; Plastics & Rubber Products; Miscellaneous Manufacturing; Chemical Products; and Transportation Equipment.
| Manufacturing Change in Overall Employment |
|
Reported for
2021 (since
May)Dec 2021 |
Magnitude
of Change |
Reported
for 2021
(since Dec
2020) |
Magnitude
of Change |
Predicted for
2022Dec 2021 |
Magnitude
of Change |
| Higher |
32% |
+8.8% |
48% |
+9.7% |
36% |
+10.3% |
| Same |
45% |
NA |
43% |
NA |
40% |
NA |
| Lower |
23% |
-10.8% |
9% |
-15.2% |
24% |
-11.2% |
| Net Average |
|
+0.3% |
|
+3.3% |
|
+1.0% |
Services
ISM’s Services Business Survey Committee members report that sector employment has increased 0.1 percent since May 2021. They forecast that employment will increase 1 percent by the end of 2022. In the coming year, 36 percent of respondents expect higher levels of employment, 24 percent anticipate lower levels, and 40 percent expect their employment levels to be unchanged. The 17 industries anticipating increases in employment in 2022 — listed in order — are: Real Estate, Rental & Leasing; Accommodation & Food Services; Arts, Entertainment & Recreation; Mining; Finance & Insurance; Retail Trade; Wholesale Trade; Utilities; Construction; Information; Management of Companies & Support Services; Public Administration; Professional, Scientific & Technical Services; Other Services; Educational Services; Transportation & Warehousing; and Health Care & Social Assistance.
| Services Change in Overall Employment |
|
Reported for
2021 (since
May)Dec 2021 |
Magnitude
of Change |
Reported
for 2021
(since Dec
2020) |
Magnitude
of Change |
Predicted for
2022Dec 2021 |
Magnitude
of Change |
| Higher |
36% |
+13.2% |
54% |
+9.6% |
36% |
+15.0% |
| Same |
39% |
NA |
38% |
NA |
40% |
NA |
| Lower |
25% |
-19.1% |
8% |
-8.1% |
24% |
-19.1% |
| Net Average |
|
+0.1% |
|
+4.5% |
|
+1.0% |
Note: A diffusion index above 50 percent would generally indicate an expectation of higher employment; below 50 percent, an expectation of lower employment.
EXPORT BUSINESS — Predicted Change for Next Half Year (First Half of 2022)
Manufacturing
Survey responses indicate executives expect increases in new export orders for the first half of 2022. Of the 76 percent of respondents who reported export sentiment, 49 percent predict an increase (46 percent moderate and 3 percent substantial) over the next six months. Slightly more than 6 percent of respondents predict a decrease (5 percent moderate and 1 percent substantial) in their exports, and 45 percent anticipate no change in exports over the next six months. The 11 industries expecting growth in exports during the first half of 2022 — listed in order — are: Miscellaneous Manufacturing; Computer & Electronic Products; Chemical Products; Food, Beverage & Tobacco Products; Furniture & Related Products; Primary Metals; Machinery; Transportation Equipment; Plastics & Rubber Products; Electrical Equipment, Appliances & Components; and Fabricated Metal Products.
Services
For the first half of 2022, services respondents who report that their organizations engage in exporting are less optimistic concerning their export business. Of the 20 percent of services business survey respondents who report that they export, 20 percent predict an increase (18 percent moderate and 2 percent substantial) over the next six months. Four percent of the respondents expect a decrease in their exports (4 percent moderate and 0 percent substantial), and 76 percent anticipate no change in exports over the next six months. Of the industries that report they export, the seven expecting growth in export business in the first half of 2022 — listed in order — are: Agriculture, Forestry, Fishing & Hunting; Finance & Insurance; Utilities; Transportation & Warehousing; Mining; Professional, Scientific & Technical Services; and Wholesale Trade.
| Predicted Change in Export Business — Next Half Year |
|
Manufacturing |
Services |
|
Predicted
For 2021 |
Predicted
For 2022 |
Predicted
For 2021 |
Predicted
For 2022 |
|
First Half
of 2021Predicted
Dec 2020 |
First Half
of 2022Predicted
Dec 2021 |
First Half
of 2021Predicted
Dec 2020 |
First Half
of 2022Predicted
Dec 2021 |
| Substantial Increase |
2% |
3% |
0% |
2% |
| Moderate Increase |
51% |
46% |
8% |
18% |
| No Change |
42% |
45% |
82% |
76% |
| Moderate Decrease |
5% |
5% |
10% |
4% |
| Substantial Decrease |
0% |
1% |
0% |
0% |
| Diffusion Index |
74.0% |
71.4% |
49.0% |
58.1% |
IMPORT BUSINESS — Predicted Change for Next Half Year (First Half of 2022)
Manufacturing
Respondents expect increases in imports in the first half of 2022. Of the 92 percent of purchasers who reported they import, 41 percent predict an increase in their imports over the next six months (35 percent moderate and 6 percent substantial), while 12 percent predict a decrease in imports of materials (10 percent moderate and 2 percent substantial). The remaining 47 percent of survey respondents expect no change in imports in the first half of 2022. The 12 industries expecting growth in imports — listed in order — are: Wood Products; Furniture & Related Products; Computer & Electronic Products; Textile Mills; Chemical Products; Miscellaneous Manufacturing; Transportation Equipment; Nonmetallic Mineral Products; Plastics & Rubber Products; Food, Beverage & Tobacco Products; Primary Metals; and Machinery.
Services
Services executives have higher expectations for the use of imports for the first half of 2022 than they did in December 2020 for the first half of 2021. Of the 49 percent of services organizations who reported they import, 30 percent (26 percent moderate and 4 percent substantial) predict an increase in their imports during the first half of 2022. Eighteen percent of respondents (9 percent moderate and 9 percent substantial) predict a decrease in imports of materials and services. The remaining 52 percent expect no change in imports over the next six months. The eight industries expecting growth in imports — listed in order — are: Finance & Insurance; Retail Trade; Professional, Scientific & Technical Services; Utilities; Wholesale Trade; Mining; Construction and Educational Services.
| Predicted Change in Import Business — Next Half Year |
|
Manufacturing |
Services |
|
Predicted
For 2021 |
Predicted
For 2022 |
Predicted
For 2021 |
Predicted
For 2022 |
|
First Half
of 2021Predicted
Dec 2020 |
First Half
of 2022Predicted
Dec 2021 |
First Half
of 2021Predicted
Dec 2020 |
First Half
of 2022Predicted
Dec 2021 |
| Substantial Increase |
4% |
6% |
1% |
4% |
| Moderate Increase |
32% |
35% |
19% |
26% |
| No Change |
47% |
47% |
69% |
52% |
| Moderate Decrease |
15% |
10% |
11% |
9% |
| Substantial Decrease |
2% |
2% |
0% |
9% |
| Diffusion Index |
59.3% |
64.8% |
54.3% |
56.6% |
INVENTORY-TO-SALES RATIO
Manufacturing
Of the manufacturing panel, 33 percent anticipate increasing their purchased inventory-to-sales ratio during 2022. An additional 18 percent expect their ratio to drop, and 49 percent see no change. The diffusion index of 57.9 percent suggests the inventory-to-sales ratio will increase in 2022.
Services
Seventeen percent anticipate increasing their purchased inventory-to-sales ratio during 2022. An additional 15 percent expect their ratio to drop, and 68 percent see no change. The diffusion index of 51.5 percent suggests the inventory-to-sales ratio will increase in 2022.
| Predicted Change in Purchased Inventory-to-Sales Ratio |
|
Manufacturing |
Services |
|
For 2021
Predicted
Dec 2020 |
For 2022
Predicted
Dec 2021 |
For 2021
Predicted
Dec 2020 |
For 2022
Predicted
Dec 2021 |
| Greater |
20% |
33% |
12% |
17% |
| Same |
65% |
49% |
84% |
68% |
| Smaller |
15% |
18% |
4% |
15% |
| Diffusion Index |
52.8% |
57.9% |
54.0% |
51.5% |
Note: A diffusion index above 50 percent would indicate an increase in the inventory-to-sales ratio; below 50 percent, a decrease in the ratio.
U.S. DOLLAR — Predicted Strength vs. Major Trading Currencies — in 2022 — Manufacturing Only
Manufacturing
Purchasing and supply executives are expecting the U.S. dollar will generally weaken in 2022 against all the foreign currencies listed below, except the Mexican peso. The average diffusion index for this forecast is 44.8 percent, a decrease of 3.7 percentage points compared to the December 2020 forecast average of 48.3 percent for 2021.
| U.S. Dollar Will Be: |
Euro |
Canada
$ |
British
Pound |
Japanese
Yen |
Mexican
Peso |
Korean
Won |
Taiwan
$ |
| Stronger than |
26% |
24% |
26% |
26% |
36% |
23% |
25% |
| Same as |
28% |
42% |
37% |
36% |
35% |
40% |
36% |
| Weaker than |
46% |
34% |
37% |
38% |
29% |
37% |
39% |
| Diffusion Index |
40.3% |
45.1% |
44.7% |
44.0% |
53.3% |
43.3% |
43.1% |
Note: A diffusion index above 50 percent would predict a generally stronger U.S. dollar; below 50 percent, a generally weaker U.S. dollar, with the distance from 50 percent indicative of the predicted strength or weakness.
BUSINESS REVENUES
Business Revenues Comparison — 2021 vs. 2020
Manufacturing
Summarizing revenues for 2021, 62 percent of respondents say revenue was better than 2020. Overall, revenues increased an average of 14.1 percent over 2020. Fifteen percent say their revenues decreased in 2021 by an average of 11.1 percent, and the remaining 23 percent indicate no change. Overall, purchasing and supply executives indicate a net increase of 14.1 percent in business revenues for 2021 over 2020. This is more than the 7.2-percent increase that was forecast in May 2021 for all of 2021 and more than the 6.9-percent increase predicted in December 2020 for all of 2021. The 15 industries reporting increases in revenues in 2021 — listed in order — are: Petroleum & Coal Products; Apparel, Leather & Allied Products; Primary Metals; Fabricated Metal Products; Computer & Electronic Products; Machinery; Plastics & Rubber Products; Electrical Equipment, Appliances & Components; Chemical Products; Miscellaneous Manufacturing; Food, Beverage & Tobacco Products; Transportation Equipment; Furniture & Related Products; Paper Products; and Textile Mills.
| Manufacturing Business Revenues — 2021 vs. 2020 |
|
Predicted
Dec 2020 |
% Change |
Predicted
May 2021 |
% Change |
Reported
Dec 2021 |
% Change |
| Higher |
59% |
+12.7% |
59% |
+13.8% |
62% |
+25.7% |
| Same |
31% |
NA |
33% |
NA |
23% |
NA |
| Lower |
10% |
-7.0% |
8% |
-13.3% |
15% |
-11.1% |
| Net Average |
|
+6.9% |
|
+7.2% |
|
+14.1% |
Services
Services supply management executives report that business revenues for 2021 increased compared to 2020 by 4.8 percent. This is greater than the 5.4-percent decrease predicted in May 2021 for all of 2021. The 51 percent of respondents reporting better business in 2021 than in 2020 estimate an average revenue increase of 15.6 percent. This contrasts with an average decrease of 20.8 percent reported by the 15 percent of respondents who indicate worse business in 2021. The remaining 34 percent have experienced no change in 2021. The 16 industries reporting increases in revenues in 2021 are: Mining; Arts, Entertainment & Recreation; Wholesale Trade; Accommodation & Food Services; Other Services; Finance & Insurance; Management of Companies & Support Services; Utilities; Construction; Information; Transportation & Warehousing; Educational Services; Retail Trade; Public Administration; Health Care & Social Assistance; and Agriculture, Forestry, Fishing & Hunting.
| Services Business Revenues — 2021 vs. 2020 |
|
Predicted
Dec 2020 |
% Change |
Predicted
May 2021 |
% Change |
Reported
Dec 2021 |
% Change |
| Higher |
40% |
+11.3% |
48% |
+15.0% |
51% |
+15.6% |
| Same |
43% |
NA |
41% |
NA |
34% |
NA |
| Lower |
17% |
-17.2% |
11% |
-16.6% |
15% |
-20.8% |
| Net Average |
|
+1.6% |
|
-5.4% |
|
+4.8% |
Business Revenues Prediction for 2022
Manufacturing
Manufacturing survey respondents forecast that business revenues for 2022 will be stronger than in 2021. The 65 percent of respondents forecasting better organizational business revenues in 2022 estimate an average increase of 11.6 percent. This contrasts with an average decrease of 10.5 percent forecast by the 11 percent who predict lower business revenues in 2022. Including the 24 percent who see no change in 2022, the forecast for overall net increase in business revenues for 2022 is 6.5 percent. Fifteen of the 18 manufacturing industries expecting revenue improvement in 2022, in the following order, are: Apparel, Leather & Allied Products; Machinery; Computer & Electronic Products; Fabricated Metal Products; Transportation Equipment; Primary Metals; Miscellaneous Manufacturing; Chemical Products; Furniture & Related Products; Food, Beverage & Tobacco Products; Electrical Equipment, Appliances & Components; Petroleum & Coal Products; Printing & Related Support Activities; Nonmetallic Mineral Products; and Paper Products.
Services
Services survey respondents forecast that business revenues for 2022 will improve by an average of 4.3 percent. This is less than the 4.8-percent decrease reported for 2021, and more than the 1.6-percent increase predicted one year ago for 2021 revenues. The 54 percent of respondents forecasting better business in 2022 estimate an average revenue increase of 12.5 percent. This contrasts with an average decrease of 21 percent forecast by the 12 percent who predict worse business in 2022. The remaining 34 percent see no change. The 17 industries expecting increases in revenues in 2022 — listed in order of percentage increase — are: Mining; Accommodation & Food Services; Information; Arts, Entertainment & Recreation; Finance & Insurance; Wholesale Trade; Management of Companies & Support Services; Agriculture, Forestry, Fishing & Hunting; Construction; Utilities; Professional, Scientific & Technical Services; Other Services; Retail Trade; Public Administration; Transportation & Warehousing; Educational Services; and Health Care & Social Assistance.
| Business Revenues — 2022 vs. 2021 |
|
Manufacturing |
Services |
|
Predicted
Dec 2021 |
% Change |
Predicted
Dec 2021 |
% Change |
| Higher |
65% |
+11.6% |
54% |
+12.5% |
| Same |
24% |
NA |
34% |
NA |
| Lower |
11% |
-10.5% |
12% |
-21.0% |
| Net Average |
|
+6.5% |
|
+4.3% |
|
|
|
|
|
|
|
|
|
|
|
|
PROFIT MARGINS
Manufacturing
Survey respondents report that profit margins decreased on average during the second and third quarters of 2021, as 22 percent experienced an increase in profit margins, 42 percent had lower margins, and 36 percent reported no change. Expectations are higher between now and May 2022, as 34 percent of respondents forecast better profit margins, 23 percent predict lower profit margins, and 43 percent predict no change. The nine industries expecting an increase in profit margins through May 2022 — listed in order of percentage increase — are: Computer & Electronic Products; Furniture & Related Products; Nonmetallic Mineral Products; Food, Beverage & Tobacco Products; Chemical Products; Electrical Equipment, Appliances & Components; Miscellaneous Manufacturing; Machinery; and Fabricated Metal Products.
Services
Among services supply management executives, 24 percent indicated their organizations experienced an increase in profit margins during the second and third quarters of 2021, 30 percent found smaller profit margins, and 46 percent had no change in margins during the same period. From now through May 2022, 26 percent of supply managers expect improved profit margins, 23 percent expect lower profit margins, and the remaining 51 percent of respondents anticipate no change. The seven industries expecting an increase in profit margins through May 2022 — listed in order of percentage increase — are: Mining; Transportation & Warehousing; Management of Companies & Support Services; Professional, Scientific & Technical Services; Finance & Insurance; Wholesale Trade; and Utilities.
| Profit Margins |
|
Manufacturing |
Services |
|
May 2021 through
Dec 2021Reported Dec 2021 |
Dec 2021 through
May 2022Predicted Dec 2021 |
May 2021 through
Dec 2021Reported Dec 2021 |
Dec 2021 through
May 2022Predicted Dec 2021 |
| Better |
22% |
34% |
24% |
26% |
| Same |
36% |
43% |
46% |
51% |
| Worse |
42% |
23% |
30% |
23% |
| Diffusion Index |
39.8% |
55.6% |
46.9% |
51.7% |
BUSINESS COMPARISON
The First Half of 2022 Compared with the Last Half of 2021
Manufacturing
Survey respondents are optimistic about the next six months, as reflected in the diffusion index of 70.2 percent. Comparing their outlook for the first half of 2022 to the last half of 2021, 51 percent predict it will be better, 11 percent predict it will be worse, and 38 percent expect no change. The 15 industries expecting improvement in the first half of 2022 — listed in order — are: Apparel, Leather & Allied Products; Printing & Related Support Activities; Plastics & Rubber Products; Miscellaneous Manufacturing; Nonmetallic Mineral Products; Food, Beverage & Tobacco Products; Transportation Equipment; Computer & Electronic Products; Machinery; Furniture & Related Products; Chemical Products; Paper Products; Petroleum & Coal Products; Electrical Equipment, Appliances & Components; and Fabricated Metal Products.
Services
The first half of 2022 is predicted to be better than the last half of 2021, according to services purchasing and supply executives. The diffusion index indicating current expectations is 71 percent. Forty-nine percent of respondents expect the first half of next year to be better than the last half of 2021, 7 percent anticipate it will be worse, and 44 percent predict no change. The 15 industries expecting improvement in the first half of 2022 — listed in order — are: Real Estate, Rental & Leasing; Arts, Entertainment & Recreation; Health Care & Social Assistance; Wholesale Trade; Professional, Scientific & Technical Services; Construction; Finance & Insurance; Educational Services; Transportation & Warehousing; Other Services; Accommodation & Food Services; Management of Companies & Support Services; Mining; Public Administration; and Utilities.
| Business — First Half 2022 vs. Last Half 2021 |
|
Manufacturing |
Services |
|
Predicted
Dec 2021 |
Predicted
Dec 2021 |
| Better |
51% |
49% |
| Same |
38% |
44% |
| Worse |
11% |
7% |
| Diffusion Index |
70.2% |
71.0% |
Note: A diffusion index above 50 percent would generally indicate an expectation of the first half of the coming year being better than the second half of the current year.
The Second Half of 2022 Compared with the First Half of 2022
Manufacturing
Purchasing and supply executives are similarly optimistic about the second half of 2022 compared to the first half. The percentage of survey respondents who forecast the second half of 2022 to be better than the first half is 38 percent, while 13 percent expect it to be worse, and 49 percent expect no change. The diffusion index for the second half of 2022 is 62.9 percent, compared to 70.2 percent for the first half of 2022. The 13 industries predicting improvement in the second half of 2022 — listed in order — are: Printing & Related Support Activities; Apparel, Leather & Allied Products; Paper Products; Miscellaneous Manufacturing; Fabricated Metal Products; Transportation Equipment; Chemical Products; Electrical Equipment, Appliances & Components; Food, Beverage & Tobacco Products; Nonmetallic Mineral Products; Machinery; Furniture & Related Products; and Computer & Electronic Products.
Services
Services purchasing and supply executives feel more optimistic about the second half of 2022 than for the first half of the year. (The diffusion index for the second half is 76.2 percent, and the first half is 71.0 percent.) The percentage of respondents who currently forecast the second half of 2022 to be better than the first half is 58 percent, while 5 percent expect it to be worse. An additional 37 percent of purchasers expect no change. The 17 industries expecting improvement in the second half of 2022 — listed in order — are: Retail Trade; Real Estate, Rental & Leasing; Mining; Management of Companies & Support Services; Information; Finance & Insurance; Professional, Scientific & Technical Services; Health Care & Social Assistance; Agriculture, Forestry, Fishing & Hunting; Other Services; Construction; Wholesale Trade; Arts, Entertainment & Recreation; Transportation & Warehousing; Educational Services; Accommodation & Food Services; and Utilities.
| Business — Second Half 2022 vs. First Half 2022 |
|
Manufacturing |
Services |
|
Predicted
Dec 2021 |
Predicted
Dec 2021 |
| Better |
38% |
58% |
| Same |
49% |
37% |
| Worse |
13% |
5% |
| Diffusion Index |
62.9% |
76.2% |
Note: A diffusion index above 50 percent would generally indicate an expectation of the second half of the coming year being better than the first half.
OUTLOOK FOR THE NEXT 12 MONTHS
Manufacturing
Compared to the outlook for 2021 reported in December 2020, survey respondents this year are less optimistic about the outlook for 2022. Forty-six percent of respondents believe 2022 will be better than 2021. Forty percent of respondents believe 2022 will be the same as 2021, and 14 percent believe 2022 will be worse than 2021. The resulting diffusion index for the outlook for 2022 is 66.2 percent, compared with 77.8 percent for 2021 from one year ago.
Services
Services survey respondents are overall less optimistic on their outlook, compared to their predictions for 2021. A smaller proportion of respondents this year believe 2022 will be better than 2021. The diffusion index looking forward into 2022 of 63.3 percent is lower than the diffusion index looking forward into 2021 (69.6 percent).
| Outlook — Next 12 Months |
|
Manufacturing |
Services |
|
Predicted
for 2021
Dec 2020 |
Predicted
for 2022
Dec 2021 |
Predicted
for 2021
Dec 2020 |
Predicted
for 2022
Dec 2021 |
| Better |
63% |
46% |
49% |
47% |
| Same |
30% |
40% |
42% |
33% |
| Worse |
7% |
14% |
9% |
20% |
| Diffusion Index |
77.8% |
66.2% |
69.6% |
63.3% |
SPECIAL QUESTION TOPIC #1: HIRING WORKERS TO FILL OPEN POSITIONS
We asked the panel, “In the past six months, has your firm had difficulty hiring workers to fill open positions?”
Respondents indicated:
|
Hiring Workers to Fill Open Positions |
| Manufacturing |
Services |
| Reported
Dec
2018* |
Reported
Dec
2019 |
Reported
Dec
2021 |
Reported
Dec
2018* |
Reported
Dec
2019 |
Reported
Dec
2021 |
| We have had difficulty hiring |
78.5% |
70.3% |
81% |
72.8% |
69.4% |
81% |
| We have not had difficulty |
21.5% |
23.1% |
12% |
27.2% |
24.0% |
13% |
| Not applicable (we have not had any open positions) |
|
6.5% |
7% |
|
6.6% |
6% |
SPECIAL QUESTION TOPIC #2: HIRING DIFFICULTIES
Manufacturing
We asked the panel, “If ‘yes,’ what have you done to deal with these difficulties?”
- We raised wages (or used other forms of monetary compensation) to recruit new hires (43%)
- We didn’t hire/were not able to hire as many workers as we would have liked (35%)
- We didn’t have difficulty hiring because we weren’t trying to hire new workers (12%)
- We lowered our hiring standards (6%)
- Something else (4%)
Services
We asked the panel, “If ‘yes,’ what have you done to deal with these difficulties?”
- We raised wages (or used other forms of monetary compensation) to recruit new hires (44%)
- We didn’t hire/were not able to hire as many workers as we would have liked (43%)
- We lowered our hiring standards (3%)
- Something else (10%)
SPECIAL QUESTION TOPIC #3: NO HIRING DIFFICULTIES
Manufacturing
We asked the panel, “If you have not had difficulty hiring, why not?”
- We raised wages in order to attract the applicants we needed (31%)
- We didn’t have difficulty hiring because we weren’t trying to hire new workers (25%)
- The local labor market is not that tight; it was easy to find an ample supply of applicants (20%)
- We lowered our hiring standards (3%)
- Something else (21%)
Services
We asked the panel, “If you have not had difficulty hiring, why not?”
- We raised wages in order to attract the applicants we needed (31%)
- We lowered our hiring standards (25%)
- The local labor market is not that tight; it was easy to find an ample supply of applicants (17%)
- We didn’t have difficulty hiring because we weren’t trying to hire new workers (10%)
- Something else (17%)
SPECIAL QUESTION TOPIC #4: SUPPLY CHAIN PROBLEMS
We asked the panel, “Do you anticipate supply chain problems for the first quarter/second quarter to be better, same or worse?”
Respondents indicated:
|
Supply Chain Problems Q1 & Q2 |
| Manufacturing |
Services |
| Q1
2022 |
Q2
2022 |
Q1
2022 |
Q2
2022 |
| Better |
5% |
30% |
8% |
21% |
| Same |
47% |
40% |
46% |
46% |
| Worse |
48% |
30% |
46% |
33% |
| Diffusion Index |
28.5% |
50.1% |
30.6% |
43.7% |
SPECIAL QUESTION #5: ABILITY TO PASS PRICING INCREASES
Manufacturing
We asked the panel, “Are you able to pass price increases through to the customer?”
Services
We asked the panel, “Are you able to pass price increases through to the customer?”
SPECIAL QUESTION TOPIC #6: CAUSE OF SUPPLY CHAIN DISRUPTIONS
We asked the panel, “Are most of the supply chain disruptions in the manufacturing/services sectors due to foreign developments (for example, microchips or other foreign-sourced supplies) or to domestic developments (such as, port delays or lack of truck drivers or domestically-produced supplies like steel or aluminum)?”
Respondents indicated:
Manufacturing
- Foreign-Sourced (40%)
- Domestic-Sourced (60%)
Services
- Foreign-Sourced (44%)
- Domestic-Sourced (56%)
SPECIAL QUESTION TOPIC #7: VACCINE MANDATE
We asked the panel, “Are vaccine mandates impacting your firm’s ability to hire and retain staff?”
Respondents indicated:
Manufacturing
Services
SUMMARY
Manufacturing
The manufacturing sector is currently expanding, and the forecast indicates that it may continue in the first half of 2022, but cool slightly in the second half of 2022.
- Operating rate is currently at 88.7 percent.
- Production capacity increased by 3.5 percent in 2021.
- Production capacity is expected to increase by 6.8 percent in 2022.
- Capital expenditures increased 12.1 percent in 2021.
- Capital expenditures are expected to increase 7.7 percent in 2022.
- Prices paid increased 14.5 percent in 2021.
- Overall, 2022 prices paid are expected to increase 8.1 percent.
- Labor and benefit costs are expected to increase 4.7 percent in 2022.
- Manufacturing employment is predicted to increase 1.0 percent in 2022.
- U.S. exports growth expected in 2022.
- U.S. imports growth expected in 2022.
- Manufacturing revenues increased 14.1 percent in 2021.
- Manufacturing revenues are expected to increase 6.5 percent in 2022.
- The U.S. dollar is expected to weaken versus six of the seven major trading partner currencies in 2022.
- Manufacturing supply managers have an optimistic outlook, with 46 percent of respondents predicting 2022 will be better than 2021.
Services
The services sector continues to expand, and the forecast indicates an increased rate of expansion in 2022.
- Operating rate is currently at 89.4 percent.
- Production capacity increased 2.3 percent in 2021.
- Production and provision capacity is expected to increase 3.3 percent in 2022.
- Capital expenditures increased 15.3 percent in 2021.
- Capital expenditures are expected to increase 10.3 percent in 2022.
- Prices paid increased 10.4 percent in 2021.
- Prices paid are expected to increase 9.2 percent in 2022.
- Labor and benefit costs are expected to increase 6.1 percent in 2022.
- Employment is expected to increase 1.0 percent in 2022.
- Export levels expected to increase in 2022.
- Import growth expected in 2022.
- Services revenues are up 4.8 percent in 2021.
- Services revenues are expected to rise 4.3 percent in 2022.
- Services supply managers are positive in regard to their outlook, with 47 percent of respondents predicting 2022 will improve compared to 2021.
*Miscellaneous Manufacturing includes items such as medical equipment and supplies, jewelry, sporting goods, toys and office supplies.
**Other Services include services such as equipment and machinery repairing; promoting or administering religious activities; grant making; advocacy; and providing dry-cleaning and laundry services, personal care services, death care services, pet care services, photofinishing services, temporary parking services, and dating services.
Posted December 13, 2021
Source: Institute for Supply Management (ISM)
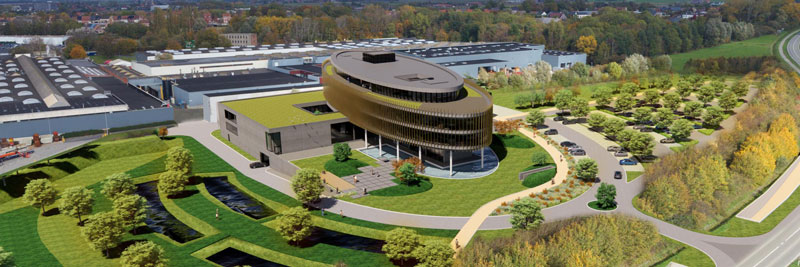 IEPER, Belgium — December 7, 2021 — Picanol Group today announced the construction of a new head office in its hometown of Ieper, Belgium. The new building will house 450 employees and it will be erected on the company’s current site, between its training center and the Zuiderring road. The architectural design of the new headquarters — which will be shaped like a weaving shuttle — reflects Picanol’s rich weaving machine manufacturing history. The building is a design by AAVO Architects and will have a floor area of 20,000 square meters, including a parking garage and a basement area of 7,500 square meters. With this project, Picanol Group is ensuring the sustainable anchoring of the group in Ieper.