 Reasons for upward trend in cotton prices and future outlook not entirely clear.
By Jon Devine
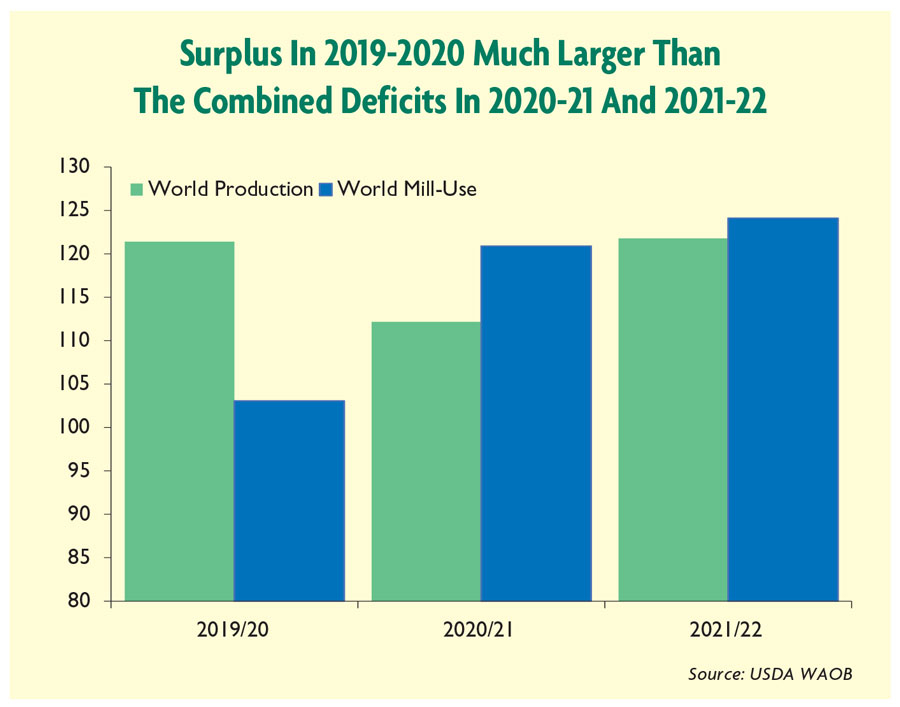
To say the least, it has been an interesting couple of years for the cotton market. With COVID, an initial effect was a large overhang in supply. Before the pandemic, the expectation was that cotton production and mill demand would be virtually even in the 2019-20 crop year. When the virus shuttered spinning mills around the world, it caused a yawning surplus. At nearly 20 million bales, it represented the second-largest addition to global supply on record, only behind the addition made to stocks in 2011-12, after the 2010-11 spike, according to market and trade data from the United States Department of Agriculture (USDA) Foreign Agricultural Service (FAS).
Since then, a global production deficit occurred in the 2020-21 crop year — 5 million bales — and a small deficit is expected for the world in the current 2021-22 crop year — 2 million bales. The net result expected after these three crop years is the addition of more than 10 million bales to global stocks, according to the USDA FAS.
Before COVID, the world was not facing a shortage of cotton. With supplies swollen, a persistent question is why cotton prices have been able to continue to climb.
Undefeated Uptrend
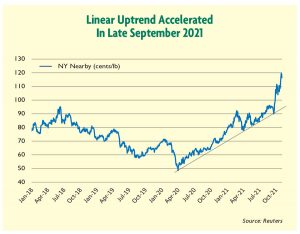
Part of the reason may be that cotton prices have simply been unable to break lower. Since April 2020, cotton prices have moved only in one direction. This has happened despite the emergence of the COVID delta variant, recurring lockdown orders around the world, persistent shipping challenges, inflation, and concerns about the future trajectory of Chinese economic growth.
Cotton’s undefeated uptrend may be partly due to what has been called the “everything rally” that has spanned financial markets. An illustration is the correlation between cotton futures and the S&P 500. Both tracked a nearly linear trend line since April 2020. Relative to their averages in January 2020 — pre-COVID — nearby cotton futures were down 31 percent at the start of April 2020 and the S&P 500 was down 25 percent. By the end of August 2021, nearby cotton futures were up 37 percent versus their January 2020 average and the S&P 500 was up 38 percent, according to data from Reuters and calculations by Cotton Incorporated.
One common thread shared among cotton and other seemingly unrelated financial markets was the rising macroeconomic tide in place since the worst of the shutdown period. Relatedly, another shared connection is exposure to the unprecedented stimulus measures that were unleashed to counter the effects of shutdowns and other restrictions on economic activity.
Among other efforts, the Federal Reserve has been pumping $120 billion of new money into the economy each month since the spring of 2020. The Fed has been doing this to prevent the collapse of asset values. In this regard, it appears to have been succeeding, with prices across many asset classes rising together.
This economic effort plus other stimulus measures, has left many U.S. consumers better off than before the pandemic. Direct payments and reduced spending lifted consumer savings rates to level nearly double those before the pandemic, according to the U.S. Bureau of Economic Analysis. On top of that, the value of consumers’ largest assets, including their homes and retirement accounts, have risen sharply according to Federal Reserve data.
 Rebound In Consumer Demand

With travel and other recreational services still affected by COVID-related regulations and concerns, this has translated into spending growth on physical goods like clothing. Relative to the same period in 2019, consumer spending on apparel has been up 25 percent over the past six months. U.S. Bureau of Economic Analysis data shows normal rates of spending growth for apparel are 2 to 3 percent, so consumer demand is well beyond what could have been expected without the virus.
Even with port congestion and rising costs, retailers and brands have been ramping up imports of finished textiles. In terms of raw cotton equivalence, U.S. imports of apparel are set to post their highest volume since 2010, and U.S. imports of home textiles are on pace to set a new record according to the USDA Cotton and Wool Outlook and Cotton Incorporated calculations.
Demand pull from other countries has not been as strong, but the world has collectively pulled out of recession. During recessions, companies commonly seek to conserve cash to survive. This generally means pulling back on orders and inventory. When demand resurfaces during the recovery, a common result is a wave of orders to refill pipelines. The scramble to secure capacity can bid up costs for materials and manufacturing.
 U.S. Supplies Tight
While stimulus and the everything rally may help explain the linear growth in prices from the spring of 2020 through the summer of 2021, desperation to secure cotton to meet near-term needs may help explain the acceleration in cotton price increases since late September.
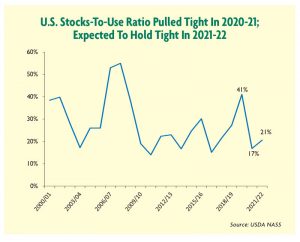
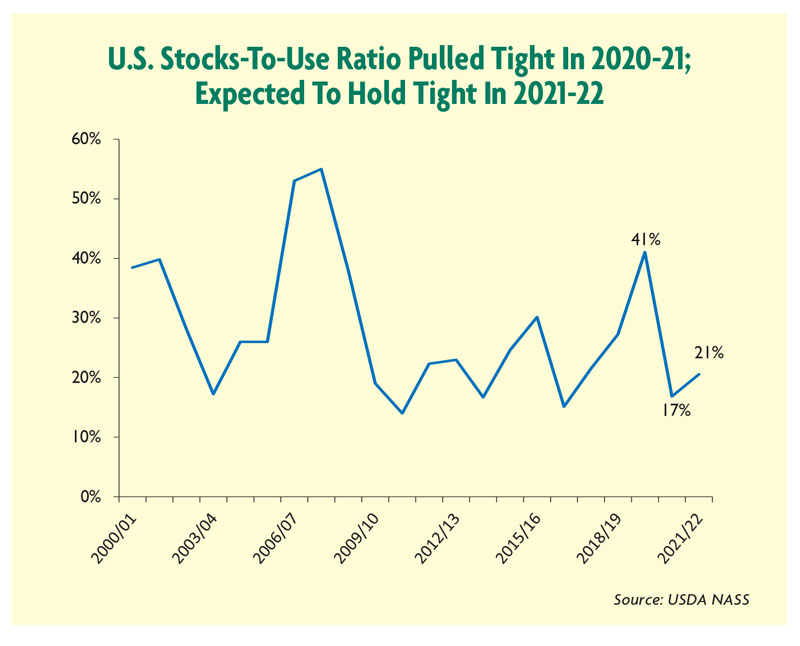
Compounding the difficulty of getting cotton shipped to mills in a timely fashion is that the world’s largest cotton exporter, the United States, experienced significant tightening last crop year. The combination of adverse weather conditions and strong demand from China caused U.S. cotton stocks to drop by more than 50 percent between the start and end of 2020-21, according to the USDA FAS.
The current stocks-to-use ratio estimate for the United States in 2021-22 is below 20 percent. This ratio has fallen below that level just a handful of times over the past couple decades. In 2021-22, the United States is expected to collect a healthy harvest. However, strong import demand from China and other markets is expected to keep U.S. stocks at relatively tight levels through the end of the 2021-22 crop year, according to USDA FAS data.
Heavy speculator investment likely has been another factor in the recent price surge. Among other possible factors, speculators could have been attracted to the cotton market due to the tightness in U.S. supply, strong Chinese purchases of U.S. cotton, and memories of what happened to cotton prices after the last recession. The Commodity Futures and Trade Commission (CFTC), the government agency that oversees all U.S. futures markets, reports positions in futures according to participant type. Between September 21 and October 5, the CFTC reported that speculator bets that cotton prices would increase grew 48 percent. That surge of money on the long side of the market could have contributed to volatility.
Looking Ahead
An old saying in commodities markets is that the best cure for high prices is high prices. The reason is that higher prices motivate producers to increase supply while they simultaneously depress demand.
One decade ago, cotton prices rose to levels much higher than they have currently. Record prices in 2010-11 resulted in a new record for global acreage in 2011-12. Those record prices also caused a seven-year depression in cotton demand, with it taking until 2017-18 for world mill-use to recover back to its 2009-10 level.
The everything rally pulled corn and soybean prices higher alongside those for cotton. However, the latest surge in the cotton market has made cotton more favorable and three-digit cotton can be expected to boost cotton acreage in the next crop year. The outlook for demand is less clear, but a slower pace could be expected to follow the initial push to refill supply chains. If forecasts for 2022-23 call for a significant surplus in the United States and globally, they could prove to be the challenge that finally upend the uptrend.
Editor’s Notes: Jon Devine is a senior economist with Cary, N.C.-based Cotton Incorporated. The information contained herein is derived from public and private subscriber news sources believed to be reliable; however, Cotton Incorporated cannot guarantee its accuracy or completeness. No responsibility is assumed for the use of this information and no express or implied warranties or guarantees are made. The information contained herein should not be relied upon for the purpose of making investment decisions. This communication is not intended to forecast or predict future prices or events.
November/December 2021


