Kontoor Brands Completes The Sale Of The Lee® Business To Authentic Brands Group

GREENSBORO, N.C.— November 3, 2026 — Kontoor Brands, Inc. today announced it has completed the sale of the Lee® business to Authentic Brands Group.

“I want to thank the Kontoor team for the tremendous effort that drove the successful completion of this transaction,” said Scott Baxter, Chief Executive Officer and Chairman of the Board of Kontoor Brands. “We now have a more focused, growth-oriented portfolio positioned to deliver stronger returns for our shareholders.”

“We are grateful to the Lee team for their contributions to Kontoor and wish them well as they write the next chapter of the brand’s iconic history,” Baxter added.

Advisors

Morgan Stanley & Co. LLC is serving as Kontoor Brands’ exclusive financial advisor and Foley & Lardner LLP as its legal advisor.

Posted: November 3, 2026

Source: Kontoor Brands, Inc.

UNIFI®, Makers Of REPREVE®, Reports Strong Gross Margin And Cash Generation In First Quarter Fiscal 2027 Results, And Closing Of A $60 Million Non-Strategic Asset Sale To Eliminate An Outstanding $55.5 Million Term Loan

GREENSBORO, N.C.— October 29, 2026 — Unifi, Inc., the makers of REPREVE® and one of the world’s leading innovators in recycled and synthetic yarns, today released operating results for the first fiscal quarter ended September 27, 2026.

Highlights

  • Net sales were $127.9 million, a decrease of 5.7% from the first quarter of fiscal 2026.
  • Revenues from REPREVE Fiber products were $36.4 million and represented 29% of net sales, compared to $39.3 million or 29% of net sales for the first quarter of fiscal 2026.
  • Gross profit was $12.5 million and gross margin was 9.8%, compared to gross profit of $3.4 million and gross margin of 2.5% for the first quarter of fiscal 2026.
  • SG&A expenses were $11.5 million, a decrease of 4.1% from the first quarter of fiscal 2026, primarily driven by cost reduction efforts.
  • Net loss was $2.0 million, or $0.11 per share, compared to a net loss of $11.4 million, or $0.62 per share, for the first quarter of fiscal 2026.
  • Adjusted EBITDA* was $6.1 million, compared to a loss of $(2.5) million for the first quarter of fiscal 2026.
  • Cash provided by operating activities was $3.7 million during the first quarter of fiscal 2027, marking the fourth consecutive quarter of positive cash generation.
  • Debt principal was $90.9 million and Net Debt* was $64.8 million at September 27, 2026.
  • Continued efforts across innovation and traceability through the introductions of CofiraTM, a versatile dual function yarn, Resist2OTM Pro, an advanced water-resistant yarn, and YarnProofTM, supporting compliance with yarn-forward requirements in North and Central America.
  • On October 28, 2026, a previously announced sale of non-strategic real estate assets was completed with gross proceeds of $60.0 million, allowing for the full payoff of an existing term loan balance of $55.5 million.

Eddie Ingle, Chief Executive Officer of Unifi, Inc., stated, “Our results for the first quarter demonstrate the continued benefits of the actions that have been implemented to improve operational efficiency and enhance both our cash generation and profitability performance. This is evident by the significant increase in gross profit year-over-year, which highlights the improved earnings potential of our business and our progress towards building a more profitable operating platform. Additionally, the recent closing on the sale of two non-strategic assets represents another important milestone in our plan to reduce debt and strengthen the balance sheet, helping create greater financial flexibility as we continue to execute our strategic priorities.”

First Quarter Fiscal 2027 Compared to First Quarter Fiscal 2026

Net sales decreased to $127.9 million from $135.7 million, primarily due to tepid customer ordering patterns in the Americas and Asia Segments stemming from geopolitical, trade, and tariff-related uncertainty, partially offset by higher sales from the Brazil Segment.

Gross profit increased to $12.5 million from $3.4 million. Americas Segment gross profit increased by $6.4 million, primarily as a result of multi-year cost reduction efforts. Brazil Segment gross profit increased by $2.5 million, primarily due to favorable pricing dynamics and sales mix. Accordingly, operating loss, net loss, and Adjusted EBITDA all improved significantly.

Cash provided by operating activities was $3.7 million compared to cash used of $8.9 million, reflecting stronger earnings performance and continued working capital discipline.

Net Debt* was $64.8 million as of September 27, 2026 compared to $67.4 million as of June 28, 2026.

Outlook

During fiscal 2027, the Company continues:

  • To focus on leveraging the improved cost footprint while investing in innovation.
  • Managing the balance sheet to ensure that the Company remains better positioned to capitalize on improved business conditions and grow over time.
  • To expect sales and profitability to improve from fiscal 2026 as the Company realizes full-year benefits from portfolio management actions, cost containment initiatives, and improved operating execution.

During the second quarter of fiscal 2027, the Company expects the following year-over-year factors:

  • Cost savings and stable demand aid in the Americas Segment.
  • Brazil Segment sales and profitability should be consistent, while raw material inflation pressures will negatively impact working capital.
  • The Asia Segment will remain pressured due to regional softness and geopolitical volatility, but profitability should remain stable given the asset light business model in the region.

Ingle concluded, “Looking ahead, we remain focused on sustaining the operational improvements that we have made over the last few years. At the same time, we continue to invest in our platform of sustainable solutions, centered on our many REPREVE offerings, and to advance the adoption of innovative solutions that will help drive future growth. While near-term market and geopolitical headwinds persist, we remain confident that we are on the right path to returning Unifi to sustainable growth and enhanced profitability.”

* Adjusted Net Loss, Adjusted EBITDA, and Net Debt are non-GAAP financial measures. The schedules included in this press release reconcile each non-GAAP financial measure to its most directly comparable GAAP financial measure.

Posted: November 3, 2026

Source: Unifi, Inc.

Car Seat, Structures and Interior Component Supplier Brose Sitech Selects Richland County, S.C. For First US Manufacturing Facility

COLUMBIA, S.C. — October 28, 2026 — Brose Sitech, a supplier of car seats, structures and interior components, today announced it selects Richland County for its first U.S. manufacturing facility. The company’s $29.5 million investment will create 330 new jobs.

Brose Sitech develops and produces complete seats, structures and other seat components. With its global headquarters in Poland, the company has 22 locations internationally, including its regional headquarters office in Detroit.

Located at the Just in Time facility in the Scout Supplier Park in Blythewood, Brose Sitech’s new 140,000-square-foot facility will supply the new Scout Motors plant with complete car seat sets.

Operations are expected to be online in 2027. Individuals interested in joining the Brose Sitech team should visit the company’s careers page.

“Establishing our first manufacturing location in Blythewood is an important milestone for Brose Sitech. The U.S. is a significant automotive market with strong opportunities for future growth. With our new production facility, we are bringing our expertise in complete seating systems closer to our customer Scout while laying the foundation for Brose Sitech’s long-term development in North America.” -Brose Sitech Columbia Inc. Executive Vice President Juan-Carlos Kieler

“With the addition of 330 new jobs in the Palmetto State, we are proud to welcome Brose Sitech to Richland County. By joining Scout Motors’ Supplier Park, the company is building on South Carolina’s position as a leader in automotive manufacturing and helping create new opportunities for our people.” -Gov. Henry McMaster

“Brose Sitech’s $29.5 million investment in Richland County will support Scout Motors’ powerful economic and industrial impact here in our state. South Carolina is in the business of innovation, and we are pleased to see companies like Brose Sitech create transformative opportunities for our region.” -Secretary of Commerce Harry M. Lightsey III

“The decision by Brose Sitech to establish its first U.S. manufacturing facility in South Carolina is a testament to the momentum created by Scout Motors’ historic investment in the Midlands. This announcement is another important step in the growth of South Carolina’s automotive industry, and I look forward to the jobs, investment and long-term economic opportunities it will create for communities across our state.” -U.S. Rep. Joe Wilson

“Brose Sitech’s investment demonstrates that Richland County is place global manufacturers want to be. This project will create new jobs and expand opportunities for residents in Richland County, while reinforcing the momentum of automotive investment across our region.” -Richland County Council Chairwoman and Columbia Area Development Partnership Co-Chair Jesica Mackey

“When we announced we would build an on-site Supplier Park at the Scout Motors Production Center last year, we promised it would lead to even more jobs, investment and economic prosperity in South Carolina. This announcement represents the beginning of that promise being fulfilled. We’re proud to partner with Brose Sitech to create more opportunities for South Carolina communities and further strengthen the local automotive supply chain.” -Scout Motors President and CEO Scott Keogh

Posted: November 3, 2026

Source: South Carolina Office of the Governor

Manufacturing PMI® At 55.5%; October 2026 ISM® Manufacturing PMI® Report

INSTITUTE FOR SUPPLY MANAGEMENT (ISM) LOGOTEMPE, Ariz. — November 2, 2026 — Economic activity in the manufacturing sector expanded in October for the 10th consecutive month, say the nation’s supply executives in the latest ISM® Manufacturing PMI® Report.

The report was issued today by Susan Spence, MBA, Chair of the Institute for Supply Management® (ISM®) Manufacturing Business Survey Committee.

“The Manufacturing PMI® registered 55.5 percent in October, 1 percentage point above the September figure of 54.5 percent. The overall economy expanded for the 24th month in a row. (A Manufacturing PMI® above 47.5 percent, over a period of time, generally indicates an expansion of the overall economy.) The New Orders Index expanded for the 10th consecutive month after four straight readings in contraction, registering 55.5 percent, up 0.2 percentage point compared to September’s figure of 55.3 percent. The October reading of the Production Index (59 percent) is 2.3 percentage points higher than the 56.7 percent recorded in September and the highest since November 2021 (60.5 percent). The Prices Index remained in expansion (or ‘increasing’ territory), registering 75.2 percent, a 2.7-percentage point decrease compared to September’s reading of 77.9 percent. The Backlog of Orders Index registered 54.6 percent, down 1.8 percentage points compared to the 56.4 percent recorded in September. The Employment Index reading of 52.4 percent is down 0.3 percentage point from September’s figure of 52.7 percent,” says Spence.

“The Supplier Deliveries Index indicated slowing performance for the 11th month in a row after one month in ‘faster’ territory. The reading of 59.1 percent is up 0.1 percentage point from its September reading of 59 percent. (Supplier Deliveries is the only ISM® PMI® Reports index that is inversed; a reading of above 50 percent indicates slower deliveries, which is typical as the economy improves and customer demand increases.)

“The Inventories Index registered 51.4 percent, returning to expansion and up 2.8 percentage points compared to September’s reading of 48.6 percent. The Customers’ Inventories Index reading of 41.6 percent is the same as in September.

“The New Export Orders Index gained 0.3 percentage points in October for a reading of 51.2 percent versus 50.9 percent in September. The Imports Index registered 52.9 percent, an increase of 1.9 percentage points compared to September’s reading of 51 percent.”

Spence continues, “In October, U.S. manufacturing activity remained in expansion territory. Of the five subindexes that make up the PMI®, four (New Orders, Production, Supplier Deliveries and Inventories) grew faster than the previous month, while Employment growth slowed down by 0.3 percentage point. In October, general sentiment got worse for a third month in a row, with 34 percent of the comments positive and 66 percent negative (a 1-to-2 ratio of positive to negative sentiment). Among negative comments, pricing volatility was mentioned in 62 percent, longer lead times 41 percent, tariffs 25 percent and the Iran war 21 percent; most comments mentioned multiple factors.

“In October, three of four demand indicators (the New Orders, Backlog of Orders and New Export Orders indexes) remained in expansion, and the Customers’ Inventories Index remained in ‘too low’ territory, contracting at the same rate as last month. A ‘too low’ status for the Customers’ Inventories Index is usually considered positive for future production.

“Regarding output, the Production Index expanded for the 12th month in a row, with the positive-to-negative comment ratio improving to 2 positive comments for every negative one (compared to the 1.6-to-1 ratio in September). The Employment Index remained in expansion but lost 0.3 percentage point. The positive-to-negative comments ratio on Employment was 1.8-to-1 in October.

“Finally, inputs (defined as supplier deliveries, inventories, prices and imports) were mixed, with the Supplier Deliveries Index increasing 0.1 percentage point, the Inventories Index gaining 2.8 percentage points and returning to expansion, and the Prices Index decreasing 2.7 percentage points. The Imports Index gained 1.9 percentage points, to 52.9 percent versus 51 percent in September.

“Looking at the manufacturing economy, 6 percent of the sector’s gross domestic product (GDP) contracted in October, compared to 2 percent in September, and 6 percent of manufacturing GDP was in strong contraction (defined as a composite PMI® of 45 percent or lower), compared to 2 percent in September. The share of sector GDP with a PMI® at or below 45 percent is a good metric to gauge overall manufacturing weakness. Of the six largest manufacturing industries, five (Machinery; Computer & Electronic Products; Transportation Equipment; Chemical Products; and Food, Beverage & Tobacco Products) expanded in October.”

The 12 manufacturing industries reporting growth in October — listed in order — are: Plastics & Rubber Products; Electrical Equipment, Appliances & Components; Machinery; Computer & Electronic Products; Textile Mills; Primary Metals; Transportation Equipment; Fabricated Metal Products; Furniture & Related Products; Chemical Products; Miscellaneous Manufacturing; and Food, Beverage & Tobacco Products. The three industries reporting a contraction in October are: Printing & Related Support Activities; Paper Products; and Nonmetallic Mineral Products.

WHAT RESPONDENTS ARE SAYING

  • “Negative, inflation, in the red’ are the three words or phrases that best describe our strategic sourcing for 2026. We generally assume inflation at 2 percent to 3 percent year over year, and we usually do a great job keeping costs under the 2-percent increase. This year, costs are up more than 6 percent, and we are not doing much to keep any of the spend categories under the target. Of the tracked items, only nine are lower, 24 are higher and six are neutral. The red is a bit disturbing. Despite the cost pressures, sales have been OK. It won’t be a great year. It’s hard to get excited about OK or just getting by. U.S. economic policy has suffered another year, making it impossible to make sound long-term decisions.” [Chemical Products]
  • “Global demand for capital scientific instrumentation assets has slowed due to continued uncertainty in the Middle East, Eastern Europe and China. Anticipation over the midterm elections and impact to funding for scientific research and the National Institutes of Health also is impacting customers’ purchasing behavior, making them focus on optimizing existing technology and tools.” [Computer & Electronic Products]
  • “Economic policies coming out of Washington continue to weigh on business conditions. Customers are unwilling to make commitments to anything other than the shortest term due to the vast uncertainty. Canadian tariffs continue to damage small U.S. businesses selling into that important market.” [Fabricated Metal Products]
  • “Inflationary pressures and volatile commodity markets continue to create challenging scenarios and unfavorable impact to purchase price variance. Diesel rates and the trucker shortage are impacting costs beyond the raw material inputs to levels I have never seen.” [Food, Beverage & Tobacco Products]
  • “Business remains strong, largely driven not only by data centers and mission critical infrastructure, but also the continued replacement of municipal infrastructures particularly related to water. Mining continues to be strong as well.” [Machinery]
  • “Explosive growth in the semiconductor and government/defense spaces has put us on our heels as we try to work through demand. The long-awaited wave has arrived for our company, and it seems the global supply chain is in similar straits. Lead times and prices are increasing, and some carry COVID-19 era delays — four weeks is now 50 weeks; a US$2,000 item six months ago is now $4,000. We are hand-to-mouth. All the while, our customers are breaking down the doors complaining about our delivery delays.” [Machinery]
  • “New month, same trends: Any commodity consumed by AI/data centers is in a crunch, both for supply and pricing. We keep wondering when the madness will stop. In spite of these challenges, our demand remains strong and the supply chain is getting by, albeit with a lot of work. As we plan next year’s budget, it’s sobering to roll up the annualized impact of (1) remaining tariffs, (2) AI-impacted commodity price increases and (3) price increases related to geopolitically influenced commodities.” [Miscellaneous Manufacturing]
  • “Customers continue to be in a wait-and-see mode. There is no momentum to purchase, as our customers’ customers aren’t in urgent need of equipment. There has been tentative talk of 2027 purchases, but no discussion of larger-than-historical needs moving into the new year. Customers continue to be gobsmacked by the high price of equipment when they ask for quotes. Typically, we see a fourth-quarter bump as customers use up end-of-year budgets. This year, that bump does not exist.” [Transportation Equipment]
  • “The trucking industry is experiencing mixed signals. While major companies are making significant strategic investments and consolidations (acquisitions, autonomous technology and electric vehicle infrastructure), underlying freight demand appears softer. Truck tonnage metrics are declining year-over-year, new-vehicle sales are falling, and consumer confidence is weakening. However, elevated diesel prices continue to support trucking company revenues through fuel surcharges, even as freight volumes remain challenged. The economy is growing at a moderate pace, with inflation concerns persisting.” [Transportation Equipment]
  • “Material shortages abound. Fuel remains high. Uncertainty remains constant. Though not a presidential election, the election-year dynamic has begun to take hold a bit. Canadian tariffs continue to have a negative impact on steel.” [Primary Metals]
MANUFACTURING AT A GLANCE

October 2026

Index Series

Index

Oct

Series

Index

Sep

Percentage

Point

Change

Direction Rate of

Change

Trend*

(Months)

Manufacturing 

PMI®

55.5 54.5 +1.0 Growing Faster 10
New Orders 55.5 55.3 +0.2 Growing Faster 10
Production 59.0 56.7 +2.3 Growing Faster 12
Employment 52.4 52.7 -0.3 Growing Slower 4
Supplier 

Deliveries

59.1 59.0 +0.1 Slowing Faster 11
Inventories 51.4 48.6 +2.8 Growing From

Contracting

1
Customers’ 

Inventories

41.6 41.6 0.0 Too Low Same 25
Prices 75.2 77.9 -2.7 Increasing Slower 25
Backlog of 

Orders

54.6 56.4 -1.8 Growing Slower 10
New Export 

Orders

51.2 50.9 +0.3 Growing Faster 4
Imports 52.9 51.0 +1.9 Growing Faster 9
OVERALL ECONOMY Growing Faster 24
Manufacturing Sector Growing Faster 10

ISM® Manufacturing PMI® Report data is seasonally adjusted for the New Orders, Production, Employment and Inventories indexes.
*Number of months moving in current direction.

COMMODITIES REPORTED UP/DOWN IN PRICE AND IN SHORT SUPPLY

Commodities Up in Price
Aluminum* (35); Copper (16); Corrugated Products (7); Diesel Fuel (3); Electronic Components (10); Energy; Freight (8); Fuel (8); Memory Components (8); Methanol; Oil Based Products (7); Paper Products; Printed Circuit Boards (4); Resins (9); Semiconductors (5); Steel (12); Steel — Hot Rolled (10); Steel — Stainless (9); Steel Products (11); and Tungsten.

Commodities Down in Price
Aluminum*; and Polypropylene Resin.

Commodities in Short Supply
Aluminum Products (2); Copper (4); Electrical Components (16); Electronic Components (20); Integrated Circuits; Memory (10); Printed Circuit Boards (4); and Steel (4).

*Indicates both up and down in price.

Note: The number of consecutive months the commodity is listed is indicated after each item.

OCTOBER 2026 MANUFACTURING INDEX SUMMARIES

Manufacturing PMI®
The U.S. manufacturing sector expanded in October for the 10th straight month following a 10-month period of contraction, registering 55.5 percent, an increase of 1 percentage point compared to September. All five subindexes that directly factor into the Manufacturing PMI® — New Orders, Production, Employment, Supplier Deliveries and Inventories — were in expansion territory, one more than in September. Of the six largest manufacturing industries, five (Machinery; Computer & Electronic Products; Transportation Equipment; Chemical Products; and Food, Beverage & Tobacco Products) expanded in October. A reading above 50 percent indicates that the manufacturing sector is generally expanding; below 50 percent indicates that it is generally contracting.

A Manufacturing PMI® above 47.5 percent, over a period of time, generally indicates an expansion of the overall economy. Therefore, the October Manufacturing PMI® indicates the overall economy grew for the 24th straight month. “The past relationship between the Manufacturing PMI® and the overall economy indicates that October reading (55.5 percent) corresponds to a 2.7-percent increase in real gross domestic product (GDP) on an annualized basis,” says Spence.

THE LAST 12 MONTHS

Month Manufacturing PMI® Month Manufacturing PMI®
Oct 2026 55.5 Apr 2026 52.7
Sep 2026 54.5 Mar 2026 52.7
Aug 2026 54.6 Feb 2026 52.4
Jul 2026 55.6 Jan 2026 52.6
Jun 2026 53.3 Dec 2025 47.9
May 2026 54.0 Nov 2025 48.0
Average for 12 months – 52.8

High – 55.6

Low – 47.9

New Orders
ISM®‘s New Orders Index expanded in October with a reading of 55.5 percent, an increase of 0.2 percentage point compared to September’s reading of 55.3 percent. “Of the six largest manufacturing industries, four (Machinery; Computer & Electronic Products; Transportation Equipment; and Chemical Products) reported increased new orders. Demand sentiment in October was 1.8 positive comments for every negative comment, a very slight improvement from last month’s 1.7-to-1 ratio,” says Spence. A New Orders Index above 51.9 percent, over time, is generally consistent with an increase in the Census Bureau’s series on manufacturing orders (in constant 2000 dollars).

The 11 manufacturing industries that reported growth in new orders in October, in order, are: Textile Mills; Electrical Equipment, Appliances & Components; Machinery; Primary Metals; Computer & Electronic Products; Miscellaneous Manufacturing; Plastics & Rubber Products; Transportation Equipment; Chemical Products; Fabricated Metal Products; and Paper Products. The four industries reporting a decline in new orders in October are: Printing & Related Support Activities; Nonmetallic Mineral Products; Food, Beverage & Tobacco Products; and Wood Products.

New Orders %Higher %Same %Lower Net Index
Oct 2026 24.2 58.9 16.9 +7.3 55.5
Sep 2026 23.4 61.1 15.5 +7.9 55.3
Aug 2026 19.0 65.4 15.6 +3.4 53.7
Jul 2026 25.6 60.2 14.2 +11.4 56.7

Production
The Production Index expanded in October for the 12th month in a row, registering 59 percent, a 2.3-percentage point increase compared to September’s reading of 56.7 percent. This is the index’s highest reading since it registered 60.5 percent in November 2021. “Of the six largest manufacturing industries, four (Computer & Electronic Products; Transportation Equipment; Machinery; and Chemical Products) reported increased production. Panelists had a 2-to-1 ratio of positive to negative comments regarding output, up from September’s 1.6-to-1 ratio,” says Spence. An index above 52 percent, over time, is generally consistent with an increase in the Federal Reserve Board’s Industrial Production figures.

The 11 industries reporting growth in production during the month of October — listed in order — are: Primary Metals; Computer & Electronic Products; Plastics & Rubber Products; Textile Mills; Transportation Equipment; Machinery; Miscellaneous Manufacturing; Chemical Products; Paper Products; Fabricated Metal Products; and Nonmetallic Mineral Products. The three industries that reported a decrease in production in October are: Printing & Related Support Activities; Food, Beverage & Tobacco Products; and Wood Products.

Production %Higher %Same %Lower Net Index
Oct 2026 27.6 60.9 11.5 +16.1 59.0
Sep 2026 25.4 62.7 11.9 +13.5 56.7
Aug 2026 25.1 62.9 12.0 +13.1 58.3
Jul 2026 25.1 64.5 10.4 +14.7 58.5

Employment
ISM®‘s Employment Index registered 52.4 percent in October, 0.3 percentage point lower than September’s reading of 52.7 percent. “Of the six big manufacturing industries, four (Machinery; Transportation Equipment; Computer & Electronic Products; and Food, Beverage & Tobacco Products) reported higher levels of employment in October. The panelist comment ratio of hiring to managing/reducing head counts was 1.8-to-1,” says Spence. An Employment Index above 50.3 percent, over time, is generally consistent with an increase in the Bureau of Labor Statistics (BLS) data on manufacturing employment.

Of the 18 manufacturing industries, eight reported employment growth in October, in the following order: Plastics & Rubber Products; Wood Products; Machinery; Electrical Equipment, Appliances & Components; Primary Metals; Transportation Equipment; Computer & Electronic Products; and Food, Beverage & Tobacco Products. The five industries reporting a decrease in employment in October are: Printing & Related Support Activities; Nonmetallic Mineral Products; Paper Products; Miscellaneous Manufacturing; and Chemical Products.

Employment %Higher %Same %Lower Net Index
Oct 2026 14.4 74.8 10.8 +3.6 52.4
Sep 2026 15.3 70.2 14.5 +0.8 52.7
Aug 2026 11.8 76.7 11.5 +0.3 51.2
Jul 2026 16.3 70.4 13.3 +3.0 52.8

Supplier Deliveries†
Delivery performance of suppliers to manufacturing organizations was slower in October for the 11th consecutive month. “The Supplier Deliveries Index registered 59.1 percent, 0.1 percentage point higher than September’s reading of 59 percent. Of the six big industries, five (Computer & Electronic Products; Machinery; Transportation Equipment; Chemical Products; and Food, Beverage & Tobacco Products) reported slower supplier deliveries,” says Spence. A reading below 50 percent indicates faster deliveries, while a reading above 50 percent indicates slower deliveries.

The 12 manufacturing industries reporting slower supplier deliveries in October, in order, are: Electrical Equipment, Appliances & Components; Fabricated Metal Products; Computer & Electronic Products; Machinery; Nonmetallic Mineral Products; Furniture & Related Products; Primary Metals; Plastics & Rubber Products; Transportation Equipment; Chemical Products; Food, Beverage & Tobacco Products; and Miscellaneous Manufacturing. Two industries (Textile Mills; and Paper Products) reported that supplier deliveries were faster in October.

Supplier Deliveries %Slower %Same %Faster Net Index
Oct 2026 21.2 75.7 3.1 +18.1 59.1
Sep 2026 21.4 75.2 3.4 +18.0 59.0
Aug 2026 21.9 74.7 3.4 +18.5 59.3
Jul 2026 21.3 75.2 3.5 +17.8 58.9

Inventories
The Inventories Index registered 51.4 percent in October, up 2.8 percentage points compared to the reading of 48.6 percent in September. “Of the six big industries, three (Food, Beverage & Tobacco Products; Transportation Equipment; and Machinery) expanded inventories in October,” says Spence. An Inventories Index greater than 44.5 percent, over time, is generally consistent with expansion in the Bureau of Economic Analysis (BEA) figures on overall manufacturing inventories (in chained 2000 dollars).

Of 18 manufacturing industries, the seven reporting higher inventories in October — in the following order — are: Printing & Related Support Activities; Plastics & Rubber Products; Textile Mills; Food, Beverage & Tobacco Products; Transportation Equipment; Electrical Equipment, Appliances & Components; and Machinery. The six industries reporting lower inventories in October — listed in order — are: Wood Products; Paper Products; Primary Metals; Fabricated Metal Products; Miscellaneous Manufacturing; and Chemical Products.

Inventories %Higher %Same %Lower Net Index
Oct 2026 14.6 72.1 13.3 +1.3 51.4
Sep 2026 11.4 75.6 13.0 -1.6 48.6
Aug 2026 14.7 73.6 11.7 +3.0 50.6
Jul 2026 11.0 78.5 10.5 +0.5 51.2

Customers’ Inventories†
ISM®‘s Customers’ Inventories Index remained in “too low” territory in October, with a reading of 41.6 percent, the same as September. (For more information about the Customers’ Inventories Index, see the “Data and Method of Presentation” section below.)

No industry reported that customers’ inventories were too high in October. The 11 industries reporting customers’ inventories as too low in October, in order, are: Nonmetallic Mineral Products; Electrical Equipment, Appliances & Components; Primary Metals; Paper Products; Fabricated Metal Products; Chemical Products; Food, Beverage & Tobacco Products; Transportation Equipment; Machinery; Miscellaneous Manufacturing; and Computer & Electronic Products. Seven industries reported no change in customers’ inventories in October compared to September.

Customers’

Inventories

%

Reporting

%Too

High

%About

Right

%Too Low Net Index
Oct 2026 76 5.8 71.5 22.7 -16.9 41.6
Sep 2026 74 5.9 71.3 22.8 -16.9 41.6
Aug 2026 75 7.3 70.9 21.8 -14.5 42.8
Jul 2026 74 6.8 67.7 25.5 -18.7 40.7

Prices†
The ISM® Prices Index registered 75.2 percent in October, 2.7 percentage points lower than the 77.9 percent reported in September; this reading also indicates that raw materials prices increased for the 25th straight month. Five of the six largest manufacturing industries — Machinery; Computer & Electronic Products; Chemical Products; Transportation Equipment; and Food, Beverage & Tobacco Products — reported price increases in October. “The Prices Index reading is still being driven by (1) increases in steel and aluminum prices that impact the entire value chain, (2) tariffs applied to many imported goods and (3) increases in petroleum-based products as a result of the Middle East conflict. Higher prices were reported by 53.1 percent of respondents in October, down 5.5 percentage points from September’s 58.6 percent,” says Spence. A Prices Index above 52.8 percent, over time, is generally consistent with an increase in the Bureau of Labor Statistics (BLS) Producer Price Index for Intermediate Materials.

In October, the 16 industries that reported paying increased prices for raw materials, in order, are: Furniture & Related Products; Printing & Related Support Activities; Fabricated Metal Products; Nonmetallic Mineral Products; Electrical Equipment, Appliances & Components; Machinery; Paper Products; Textile Mills; Wood Products; Miscellaneous Manufacturing; Computer & Electronic Products; Primary Metals; Chemical Products; Plastics & Rubber Products; Transportation Equipment; and Food, Beverage & Tobacco Products. No industries reported paying decreased prices for raw materials in October.

Prices %Higher %Same %Lower Net Index
Oct 2026 53.1 44.1 2.8 +50.3 75.2
Sep 2026 58.6 38.6 2.8 +55.8 77.9
Aug 2026 46.2 49.8 4.0 +42.2 71.1
Jul 2026 50.2 41.7 8.1 +42.1 71.1

Backlog of Orders†
ISM®‘s Backlog of Orders Index registered 54.6 percent in October, a decrease of 1.8 percentage points compared to the September reading of 56.4 percent. Of the six largest manufacturing industries, four (Machinery; Computer & Electronic Products; Food, Beverage & Tobacco Products; and Transportation Equipment) reported expansion in order backlogs in October.

The 11 industries reporting higher backlogs in October — listed in order — are: Textile Mills; Electrical Equipment, Appliances & Components; Plastics & Rubber Products; Fabricated Metal Products; Paper Products; Primary Metals; Machinery; Miscellaneous Manufacturing; Computer & Electronic Products; Food, Beverage & Tobacco Products; and Transportation Equipment. The three industries reporting lower backlogs in October are: Wood Products; Nonmetallic Mineral Products; and Chemical Products.

Backlog of Orders %

Reporting

%Higher %Same %Lower Net Index
Oct 2026 91 23.7 61.7 14.6 +9.1 54.6
Sep 2026 90 23.4 66.0 10.6 +12.8 56.4
Aug 2026 91 19.7 64.2 16.1 +3.6 51.8
Jul 2026 91 23.5 62.9 13.6 +9.9 55.0

New Export Orders†
ISM®‘s New Export Orders Index remained in expansion territory in October, registering 51.2 percent, up 0.3 percentage point from September’s reading of 50.9 percent. “Among panelists’ comments, the positive-to-negative sentiment ratio was 1-to-1.3,” says Spence.

Of the 18 manufacturing industries, the two that reported growth in new export orders in October are: Chemical Products; and Transportation Equipment. The nine industries that reported a decrease in new export orders in October — in the following order — are: Wood Products; Printing & Related Support Activities; Petroleum & Coal Products; Paper Products; Fabricated Metal Products; Food, Beverage & Tobacco Products; Electrical Equipment, Appliances & Components; Machinery; and Computer & Electronic Products. Seven industries reported no change in exports.

New Export

Orders

%

Reporting

%Higher %Same %Lower Net Index
Oct 2026 73 10.3 81.7 8.0 +2.3 51.2
Sep 2026 73 12.8 76.2 11.0 +1.8 50.9
Aug 2026 75 12.0 82.4 5.6 +6.4 53.2
Jul 2026 74 14.8 76.4 8.8 +6.0 53.0

Imports†
ISM®‘s Imports Index registered 52.9 percent in October, a 1.9-percentage point increase compared to September’s reading of 51 percent.

The seven industries reporting higher imports in October — listed in order — are: Plastics & Rubber Products; Miscellaneous Manufacturing; Primary Metals; Computer & Electronic Products; Transportation Equipment; Food, Beverage & Tobacco Products; and Machinery. The three industries that reported lower volumes in October are: Wood Products; Paper Products; and Fabricated Metal Products. Eight industries reported no change in imports in October compared to September.

Imports %

Reporting

%Higher %Same %Lower Net Index
Oct 2026 84 13.8 78.2 8.0 +5.8 52.9
Sep 2026 84 13.1 75.7 11.2 +1.9 51.0
Aug 2026 85 10.1 84.7 5.2 +4.9 52.5
Jul 2026 85 16.0 79.4 4.6 +11.4 55.7

†The Supplier Deliveries, Customers’ Inventories, Prices, Backlog of Orders, New Export Orders, and Imports indexes do not meet the accepted criteria for seasonal adjustments.

Buying Policy
The average commitment lead time for Capital Expenditures in October was 175 days, one day less than in September. The average lead time in October for Production Materials was 87 days, three days more than in September. The average lead time for Maintenance, Repair and Operating (MRO) Supplies was 46 days, three days less than in September.

Percent Reporting
Capital

Expenditures

Hand-to-

Mouth

30 Days 60 Days 90 Days 6 Months 1 Year+ Average

Days

Oct 2026 16 5 8 14 28 29 175
Sep 2026 17 2 9 14 29 29 176
Aug 2026 18 3 8 13 31 27 171
Jul 2026 16 3 7 13 36 25 172


Percent Reporting
Production

Materials

Hand-to-

Mouth

30 Days 60 Days 90 Days 6 Months 1 Year+ Average

Days

Oct 2026 10 22 27 25 9 7 87
Sep 2026 11 24 23 23 15 4 84
Aug 2026 10 24 26 23 12 5 84
Jul 2026 8 23 25 26 13 5 87


Percent Reporting
MRO Supplies Hand-to-

Mouth

30 Days 60 Days 90 Days 6 Months 1 Year+ Average

Days

Oct 2026 31 31 20 12 5 1 46
Sep 2026 28 34 19 13 4 2 49
Aug 2026 29 37 18 9 5 2 48
Jul 2026 26 38 18 11 5 2 50


Posted: November 3, 2026

Source: Institute for Supply Management

Reju Expands Industry Network Through Its Work With Six Mills 

PARIS — November 3, 2026 — Reju, the textile-to-textile regeneration company, today announced that it has been collaborating with six mills to develop fabrics in order to accelerate the integration of regenerated polyester into the global textile supply chain. The work is being carried out with A. Sampaio, RDD Textiles, Tintex Textiles, FOV Fabrics and Utenos in Europe and Swisstex Direct in the United States, thereby growing a network for premium knitting, seamless construction, technical wovens, and advanced dyeing and finishing. The ongoing work is designed to move Reju’s regenerated polyester further downstream, from raw output at itsfuture Regeneration Hubs into finished fabric.

Together, these six mills bring complementary specializations across the textile value chain: 

  • Sampaio, a +79 year-old Portuguese leader in circular knitted fabrics
  • RDD Textiles, a Portuguese seamless and circular knit producer with certifications for recycled content traceability
  • Swisstex Direct, a sustainable knitting, dyeing and finishing provider based in Los Angeles, California and El Salvador
  • Tintex Textiles, a certified B Corp specializing in smart jersey fabrics with advanced, lower-impact dyeing and finishing technologies
  • FOV Fabrics, a Swedish manufacturer of high-tech woven fabrics for demanding technical and functional applications
  • Utenos Trikotazas, a vertically integrated circular knit fabric and garment manufacturer in the Baltic States, combining over 50 years of textile expertise with European manufacturing excellence

This gives Reju access to mills spanning circular knit design, chain-of-custody verified recycling, high-volume jersey production, and sustainability-certified dyeing and finishing, the manufacturing capabilities needed to move regenerated polyester from raw material into finished, market-ready fabric at scale.

Patrik Frisk

“Every selected mill with whom we are working adds to our circular textile system,” said Patrik Frisk, CEO of Reju. “As plans for Reju’s future Regeneration Hub network grows, so will our ability to deliver a consistent, high-quality regenerated polyester that manufacturers and brands can then build on.”

Each on-going workstream is tied to specific development projects underway across Reju’s manufacturing network, work that reflects real market demand the company is tracking with its growing roster of brand with whom it has signed development agreements.

The mill announcements build on a year of strong momentum for Reju, including: the €135 million from NIKI the Dutch government funding to support the facility; the selection of Rochester, New York as its first North American regeneration hub and an additional site selection for a future regeneration hub in Lacq, France.

“By bringing mills like these into our ecosystem, we can turn regenerated material into real product,” Frisk added. “It’s how we close the loop, not just in theory, but from textile waste to finished fabric.”

With access to an expanded manufacturing network, Reju is positioning itself to deliver regenerated polyester at the quality and scale required for mainstream adoption, moving the industry closer to a true textile-to-textile circular system.

Posted: November 3, 2026

Source: Reju

FiltXPO™ 2026 Connects Filtration Leaders, Showcases Innovations And Advances Industry Collaboration

CARY, N.C. — November 3, 2026 — FiltXPO™ 2026 brought together filtration industry leaders, manufacturers, researchers, product developers and technology innovators Oct. 28-29 at the Minneapolis Convention Center in Minneapolis, Minnesota.

Organized by INDA, the Association of the Nonwoven Fabrics Industry, FiltXPO provided a forum for industry professionals to discover innovative filtration technologies, explore emerging market opportunities, exchange technical expertise and build business relationships.

The two-day event featured an exhibition showcasing filtration products, materials, components and manufacturing technologies, and the Advances in Filtration Technical Conference, which addressed the trends and challenges shaping the future of air, gas, water and liquid filtration.

FiltXPO 2026 Innovation Award Winners Announced

A highlight of the event was the presentation of the FiltXPO 2026 Innovation Awards, recognizing advancements in filtration technology, performance and sustainability.

The winners were honored in two categories:

Air/Gas Filtration Innovation Award

Solberg Manufacturing Inc. — Fully Automated Liquid Management System

Imagine giving a vacuum system the ability to continuously manage heavy liquid loads with less operator involvement. Solberg’s Fully Automated Liquid Management System combines high-efficiency liquid separation with automatic pneumatic draining in one integrated solution. Liquids are continuously captured and removed while low pressure loss supports vacuum performance, helping protect valuable equipment, simplify liquid management, and reduce maintenance demands. The result is smarter liquid management built to keep demanding vacuum processes moving.

Water/Liquid Filtration Innovation Award

Ahlstrom — Ahlstrom OptiPad™

Ahlstrom OptiPad™ is an integrated filtration system featuring innovative depth filtration media designed to maximize cooking oil performance and sustainability. Using a proprietary blend of exclusive fibers, it creates a unique micro-channel structure for ultra-efficient filtration, capturing contaminants while maintaining optimal flow. The result is extended oil life, improved food quality, reduced oil consumption, lower waste generation, and significant cost savings. OptiPad™ delivers measurable economic and environmental benefits for foodservice operators. https://discover.ahlstrom.com/introducing-optipad

The following finalists were also recognized for their contributions to advancing filtration technology:

  • Air/Gas Filtration: HIFYBER — CombiNano; Leanfil Oy — Leanfil®
  • Water/Liquid Filtration: Acuriant Technologies Inc. — CUF Flow – More Water, Same Footprint; Gessner, a Mativ Brand — GESSNER PFAS Filter Media

The awards recognize innovations that advance filtration performance, operational efficiency and environmental sustainability.

Advances in Filtration Technical Conference Explores Emerging Technologies

Co-organized by INDA and the American Filtration and Separations Society (AFS), the Advances in Filtration Technical Conference brought together industry experts to examine the technologies, market forces and emerging applications transforming the filtration industry.

The conference addressed critical developments in advanced filter media, PFAS, artificial intelligence, data center filtration, water treatment, sustainability and next-generation filtration applications.

Through technical presentations and industry discussions, participants gained insights into evolving performance requirements, regulatory challenges, market opportunities and technological advancements influencing filtration product development and manufacturing.

Filter Media Course Builds Technical Expertise

Preceding FiltXPO, the two-day Filter Media Course, held Oct. 26-27, provided participants with foundational and applied knowledge of nonwoven filter media and their applications in air, liquid and aerosol filtration.

The course explored filtration technologies, performance requirements, emerging industry needs and opportunities for future product development.

The course was led by:

  • Behnam Pourdeyhimi, PhD, William A. Klopman Distinguished Professor of Textile Materials, associate dean for industry research and extension at North Carolina State University, and executive director emeritus of The Nonwovens Institute.
  • Hooman Tafreshi, PhD, professor of mechanical and aerospace engineering at NC State University.
  • Benoit Maze, PhD, director of education and administration at The Nonwovens Institute.

INDA will continue its filtration education offerings with a one-day Filter Media Essentials course March 22, 2027, preceding IDEA®27 in Kansas City, Missouri.

FiltXPO Returns in 2028

Building on the industry’s continued commitment to innovation and collaboration, FiltXPO will return March 29-30, 2028, in Charlotte, North Carolina.

Additional details about FiltXPO 2028 will be available in May 2027 at www.filtxpo.com.

Posted: November 3, 2026

Source: INDA, the Association of the Nonwoven Fabrics Industry

Pellon, A Legacy Name In Interfacing And Non-Woven Fabrics Acquired By PCP Ventures LLC

CLEARWATER, Fla.— November 3, 2026 — PCP Ventures LLC, a Florida-based investor group, announced that it completed the acquisition of Pellon on October 1.

Pellon is a globally recognized textile brand that makes specialty materials used in everything from clothing and quilts to home décor and crafts.

Pellon’s products help give finished items shape, support, softness and cushioning, and include interfacings, stabilizers, batting, fiberfill, foams and other specialty fabrics.

The company, which employs approximately 95 people, produces its products at a 220,000-square-foot manufacturing facility in Clearwater, Florida.

Pellon has been a globally trusted name among sewists and quilters for decades, so much so that “Pellon” is widely used as the generic term for interfacing. The brand’s products are often described as the “Magic in the Middle” characterized as the hidden yet essential materials inside a project that provide the support, structure, and functionality needed to bring the finished product together.

Under PCP Ventures, Pellon will continue providing products for do-it-yourself sewing enthusiasts through stores such as Walmart, Hobby Lobby and Michael’s. The company sees tremendous potential in expanding its reach to users in other industries. The market is vast, given that Pellon’s products can be used in apparel, quality, sewing, furniture and a wide range of consumer applications.

Leadership Committed to the Brand

PCP Ventures is led by a Florida-based investment group representing family offices with combined assets of close to $1 billion, including Adam Schoenbaum and Ron Ciganek. The group brings experience in commercial real estate, manufacturing, consumer brands, distribution, finance and turnaround leadership.

“We are incredibly excited about Pellon,” said Adam Schoenbaum, co-founder of PCP Ventures. “Very few brands become a household name in any category, and Pellon has done exactly that in a $27 billion market in the U.S. alone. Walk into any fabric store or talk to any quilter, and they know the name.

“We hope to continue to foster that trust earned over decades. Our job is to invest in the people, the plant and the product so Pellon is stronger for the next 75 years than it has ever been.” Schoenbaum added.”

Amy Berg, vice president of sales, who has been with Pellon for 15 years, welcomed the new ownership.

“Pellon is more than a brand, we are family,” she said. “We have team members who have been here for decades, and there’s a real sense of pride in what we do and the relationships we’ve built. We’re excited to have new owners who value our people and are committed to investing in our future.”

Seventy-Five Years of the “Magic in the Middle”

Pellon’s story began in 1950, when the Pellon trademark was developed in connection with Freudenberg, the German nonwovens pioneer whose innovations helped establish a new category of textile materials. Early Pellon interfacing offered an alternative to the woven canvases and haircloth traditionally used by tailors to give garments shape and structure.

Interfacing is a material placed between layers of fabric to provide support and stability in items such as collars, cuffs and waistbands. Pellon brought these materials to American home sewists and garment makers, and the brand became synonymous with interfacing in the sewing community.

Over the decades, Pellon expanded beyond its original interfacing products. Its portfolio now includes fusible and sew-in interfacings, stabilizers, quilt batting, fiberfill, fusible fleece, craft foams, fusible tapes and other specialty materials. These products help provide structure, durability, adhesion, cushioning, filtration and other functional properties across a wide range of applications.

Today, Pellon serves diverse markets, including hobby and crafting, apparel, quilting, furniture and home décor. Its products reach customers through a broad network of retail and industry partners, including Walmart, Michaels, and Hobby Lobby in the U.S., and worldwide through distributors that reach over 5,000 other stores.

While PCP’s acquisition came out of the bankruptcy process, Pellon has always been a fundamentally strong business. PCP’s leaders saw a solid business with a great brand and loyal customers. Pellon didn’t need to start over;  it just needed the right investment and a fresh direction to achieve long-term sustainability.

What’s Next for Pellon

PCP Ventures plans to invest in Pellon’s Clearwater 220,000-square-foot manufacturing facility, its workforce and its systems/equipment to improve production, service levels, speed to market and most importantly, best-in-class quality of products.

Customers can continue to find the full Pellon product line at retail partners. Existing customer, distributor and supplier relationships will continue without disruption.

Posted: November 3, 2026

Source: PCP Ventures LLC

Nonwovenn And Technical Materials Group Appoint Ned Dorbin As CEO To Lead Next Phase Of Growth

BRIDGWATER, England— November 3, 2026 — Ned Dorbin has been announced as Chief Executive Officer of Nonwovenn and of Technical Materials Group (TMG), as the combined businesses look to accelerate growth, working towards ambitious targets over the next few years.

Ned is familiar with Nonwovenn having spent six years as a non-executive director between 2016 and 2022. He has 19 years of experience as a private equity investor, supporting the growth of businesses across a wide range of sectors with funding and strategic board input.

Ned Dorbin

Nonwovenn and TMG plan to significantly increase their scale over the coming years through a combination of organic growth and acquisitions. As CEO, Ned will be responsible for leading the businesses through this next phase, providing strategic direction and driving commercial performance. His experience of working with management teams, supporting investment decisions and scaling businesses will be central to delivering these ambitions.

Former CEO Andrew Brownlow remains an important part of the leadership team, with an increased focus on strategic projects, capital investment programmes and operational development.

Ned Dorbin, Chief Executive Officer at Nonwovenn and Technical Materials Group, said: “I’m delighted to be joining Nonwovenn and TMG. Having previously worked with Nonwovenn, I know how well positioned the business is to expand and capitalise on the opportunities ahead. I’m excited to work with the team to build on what has already been achieved and deliver our ambitions for the future.”

David Lamb, Chairman of Nonwovenn
Picture by Roger Moody / Guzelian

David Lamb, Executive Chairman at Nonwovenn, said: “Appointing Ned is an important step for Nonwovenn and TMG as we look to deliver our ambitious growth plans. We have known Ned for many years and have seen first-hand the commercial insight and strategic leadership he brings to businesses. His experience, combined with his existing knowledge of Nonwovenn, makes him the right person to lead us through its next phase. I would also like to thank Andrew for his leadership and the significant role he has played in creating the strong foundations that we will continue to build on.”

Posted: November 3, 2026

Source Nonwovenn

Techtextil And Texprocess 2028 Strengthen Networking And Business Opportunities Along The Textile Value Chain

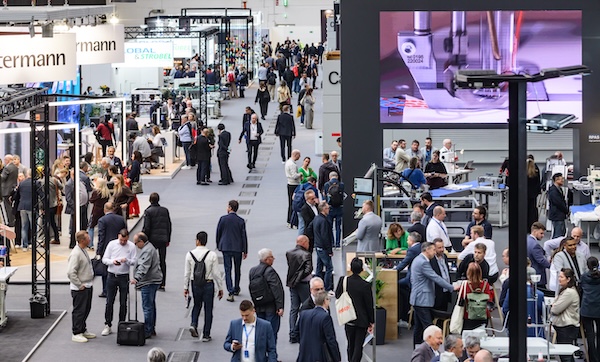
FRANKFURT AM MAIN, Germany — November 3, 2026 — Techtextil and Texprocess 2028 bring relevant market players even closer together. The focus is on the interfaces between materials, technology and processing – where innovations, new applications and business contacts emerge. The optimised hall layout supports this networking across the exhibition grounds, with short distances and an efficient route along the various stages of textile production and processing. Companies can register at early-booking rates until the end of November. The first renowned exhibitors have already registered.

Photo: Messe Frankfurt / Pietro Sutera Techtextil-Texprocess-2026
Techtextil-Texprocess 2026
Photo: Messe Frankfurt / Pietro Sutera

Volatile markets, cost pressures and changing supply chains are challenging the global textile industry. At the same time, material innovations and new technologies such as AI are opening up additional applications and business opportunities. Collaboration along the value chain is essential. Techtextil and Texprocess bring together relevant market players in Frankfurt from 4 to 7 April 2028 who are shaping this transformation – from research and technology providers to manufacturers and processors as well as users from a wide range of industries.

A major benefit lies in running the two leading trade fairs concurrently: together, they cover key production and processing stages at a single location, giving exhibitors access to new partners and fields of application beyond their own markets.

Visitor behaviour also shows how closely the potential of the two events is intertwined: in 2026, 87 percent of Texprocess trade visitors also attended Techtextil. Conversely, 68 percent took advantage of what Texprocess had to offer. Around 80 percent of exhibitors achieved their trade fair objectives.

First leading industry players commit to 2028

Right from the start of the registration phase, renowned exhibitors are already committing to Techtextil and Texprocess 2028: Angles Textil / Antex, Beaulieu Fibres International, CHT, Dilo Systems, Getzner Textil, Huvis Corporation, Lenzing, Sioen Industries and Toray Textiles Europe are among the first international market leaders to register for Techtextil. Established industry players such as Kornit, Veit and ZSK Stickmaschinen have also confirmed their participation in Texprocess. Further companies can register without obligation at early-booking rates until 30 November 2026.

Textile round trip from material innovation to processing

In 2028, Techtextil and Texprocess link complementary product areas and processes even more effectively. Spanning five hall levels, the route across the western exhibition grounds follows the textile value chain: it starts with Techtextil’s production technologies in Hall 8.0. From there, the tour leads to fibres and yarns in Hall 12.0, through technical textiles and nonwovens in Halls 12.0 and 12.1, and on to coated textiles and composites in Hall 11.0.

Nearby, Hall 9.0 brings together textile auxiliaries and chemicals for the various production stages, as well as Performance Apparel Textiles close to the relevant finishing processes. The route comes full circle in Hall 8.0, where Techtextil’s production technologies meet Texprocess’ technologies for processing textile and flexible materials. This spatial integration creates direct connections between materials, technologies and processing. Exhibitors benefit from close proximity to relevant suppliers, partners and potential new customers. Trade visitors can find suitable companies more quickly and explore interconnected production stages and solutions in their direct context.

Posted: November 3, 2026

Source: Messe Frankfurt Exhibition GmbH

ReHubs Invites Industry Leaders To Help Shape The Conference Program At Textiles Recycling Expo 2027 

BRUSSELS — November 3, 2026 — ReHubs is proud to continue its collaboration with Textiles Recycling Expo as the Structural Partner for the third consecutive year, reinforcing its commitment to bringing together the organisations, expertise and solutions needed to scale textile-to-textile recycling across Europe.

As preparations begin for the 2027 edition in Brussels, ReHubs is calling on organisations across the textile value chain to contribute their expertise and help shape a conference programme that reflects the industry’s most important challenges, innovations and opportunities.

Béatrice Moureaux, recently appointed CEO of ReHubs, sees the Textiles Recycling Expo as an important opportunity to bring the industry’s different perspectives together and accelerate progress towards commercially viable circularity.

“Europe has made significant progress in developing textile recycling technologies, but innovation alone will not deliver circularity at scale. We need to address the economic and structural barriers that are preventing these solutions from becoming commercially viable. Textiles Recycling Expo provides an important platform to bring the entire value chain together, challenge existing thinking and share practical solutions. ”

Through its continued partnership with the Expo, ReHubs aims to encourage dialogue across the value chain and help ensure that the conference reflects both the challenges facing the sector and the practical opportunities for collective progress.

The Call for Speakers is now open, offering experts the opportunity to present their research, technologies, case studies and insights to a highly engaged audience of recycling professionals, brands, manufacturers, policymakers and investors.

Alongside the conference, entries for the Textiles Recycling Awards are now open. With six categories, free entry, and a live awards ceremony held in the conference theatre during the event, the awards provide an excellent opportunity to showcase achievements and gain industry recognition.

Companies looking to raise their profile can also exhibit at the event. With more than 100 exhibitors already booked, stand availability is becoming increasingly limited, making early booking essential.

ReHubs looks forward to seeing the wider textile recycling community represented across the conference programme, awards and exhibition floor as the industry comes together to drive textile circularity forward.

Posted: November 3, 2026

Source: ReHubs / AMI

Sponsors