NAFTA UpdateBy John E. LukeNAFTA: Six Years Of Fibers
NAFTA shows mixed results for U.S. manufacturers, but opportunity for cross-border,
intra-industry trade. Economists have a habit of reviewing results and predicting the
future in five-year increments. These professionals notwithstanding, it is now past time, six years
and 40 percent through complete implementation, to review the performance of the U.S. fiber
industry in world trade with a specific focus on accomplishments with Mexico and Canada under
NAFTA.NAFTA has been good for the U.S. fiber industry. This is not to say that the industry shipped
all it could make or that fiber prices reflected adequate investment returns. It also is not to say
that the industry was not hammered by cheap fiber and manufactured product imports from all areas
of the world. It is to say, however, that facing the inexorable advance of world/free trade as
evidenced by NAFTA and WTO passage, U.S. fiber producers found new markets in the fabric-producing
industries of our immediate North American neighbors and have turned the tri-country poundage trade
balance from a negative to a positive figure. Accurate cross-border prices are not available, but,
based upon the current border-crossing product mix, the dollar balance of trade is still somewhat
negative, although significantly improved from pre-NAFTA levels.World Fiber TradeIt is important to
note that the negative trade balance in fibers results more from increased imports than from
decreased exports. Since NAFTA, new international capacity particularly in polyester and acrylic
has lusted after the worlds largest market, and U.S. fiber imports surged from a 1995-1996 average
of 1.1 billion pounds to over 1.3 billion by 1999. Simultaneously, U.S. fiber imports from NAFTA
countries remained virtually constant at approximately 480 million pounds. This means that NAFTA
countries share of U.S. fiber imports dropped from approximately 45 percent of total to under 38
percent in the most recent year.

In exports, a contrary story has developed. Between 1995 and 1997, U.S. fiber industry
exports held steady at slightly over 1.1 billion pounds. Since that time, with world polyester
prices tanking and foreign producers offering the output of new polyester and acrylic capacity at
almost any price, domestic manufacturers pulled back; 1998 and 1999 exports dropped to under 900
million pounds. It must be noted in these figures, however, that U.S. fiber manufacturers responded
to NAFTA in the spirit in which it was created. In 1995, at 326 million pounds, U.S. fiber exports
to NAFTA countries represented 31 percent of total fiber exports. By 1999, fiber exports of 501
million pounds an increase of 11 percent per year represented almost 62 percent of total fiber
exports. NAFTA provides the economic essentials to allow and encourage U.S. producers to compete
close to home. This has brought us to a positive poundage trade balance with our NAFTA
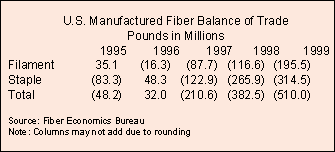
partners.Table 1 details total U.S. fiber trade since the onset of NAFTA. Regular readers of this
space will recognize the abrupt change from an industry contributing a positive balance of trade to
one mired in seemingly eternal negative balances. In a word, the pattern is ugly and speaks loudly
to changes in fiber manufacturing and distribution brought on by the political and economic
turmoil, particularly in Southeast Asia, of the 1990s.In mid-decade, American fiber producers were
struggling to maintain the positive balance of payments historically provided by the industry. The
effort was for naught, however, as economic and political forces, particularly in Asia, unleashed a
frenzy of exporting to generate hard currencies and balance overstretched economies. In fibers, as
has been noted in this space several times in the past, the forces of King Polyester descended on
the U.S. market, resulting in a 160-million-pound positive balance of filament trade in 1995
turning to a 38-million-pound negative by 1999. Similarly, polyester staple swung 100 million
pounds negative to finish 1999 at almost 400 million pounds net imports. Some backing and filling
occurred in other fiber categories, most of which, save acrylic, amounted to little more than
normal variances in trade reporting. Acrylic manufacturers, traditionally an industry sector that
exported a substantial proportion of its fiber production, suffered from recent building of
capacity in Asia, and from customer lack of hard currencies with which to pay for traditional
imports. The first negative balance in memory of acrylic trade occurred in 1999. Considering the
amount of production capacity added in acrylic and polyester in Asia in the 1990s, it is highly
unlikely that the U.S. total manufactured fiber trade balance will ever again be positive.NAFTA
Fiber TradeA recent report from the El Paso Branch of the Federal Reserve Bank of Dallas (El Paso
Business Frontier, Issue 2, 2000, hereinafter called the El Paso Report) reviewing NAFTA trade
patterns provides an interesting perspective on the current shape of cross-border trade engendered
by the treaty. According to the report, at NAFTAs inception, an amusement in the United States
centered on identifying which industries or sectors would be winners and losers in the treaty. A
winner was identified as a sector in which exports would rise as a result of the treaty; a losing
sector would see increased imports. Generally speaking, the U.S. fiber/fabric/apparel complex
designated itself as losers, a title that unfairly groups several winners into the losers category.
As cross-Rio Grande trade has unfolded, it appears that apparel manufacturing accurately falls in
the loser category. Fabric manufacturing rides a middle ground, less impacted by NAFTA than by
expanded Southeast Asian garment production that reduces the overall need for U.S.-produced
fabrics. The El Paso Report notes that in 1999, the states of North Carolina (No. 6), South
Carolina (No. 17) and Alabama (No. 22) were among the top 25 states exporting to Mexico. North
Carolina and Alabama made the list for having apparel and other textile products as their top
export, and South Carolina made it for rubber and plastics products. Together, these three states
in 1999 represented more than 3.5 percent of all exports to Mexico. In the same year, textile yarn
and fabrics and articles of apparel and clothing represented more than six percent of total U.S.
exports to Mexico.The description hints at the shape of Mexican-U.S. bilateral trade. The El Paso
Report, rather than looking for winners and losers, views trade as two positives. Imports create
opportunities for consumers to broaden purchasing patterns, often at reduced prices; exports
provide opportunities for industry to expand markets and potentially operate factories at efficient
levels. In effect, U.S.-Mexican trade is raw materials and work-in-process in and finished goods
out. Trade is moving both ways, and, in the textile complex, it is intra-industry trade with
manufacturers on each side of the border that is adding value in specialty areas. This matches the
El Paso Report description of the U.S.-Mexican macro-trade as 80 percent intra-industry. Mexican
wages are a fact, and trade has changed under NAFTA to reflect their attractiveness. It now becomes
the responsibility of raw material suppliers to optimize opportunities for business south of the
border by combining the capital advantage of U.S. manufacturing with the labor attractiveness of
Mexico.In marked contrast to the world experience and moving toward the intra-industry description,
fiber trade among the three NAFTA partners has moved from a distinct negative position in
mid-decade, soon after NAFTA implementation, to a positive balance by the end of 1999. From a
negative 165-million-pound balance in 1995, the fiber industry has fought back to a positive
10-million-pound balance in 1999. Impressively, as U.S. man-made fibers reversed negative trade
trends and fought to a positive balance, they waged a losing battle with other geographic areas.
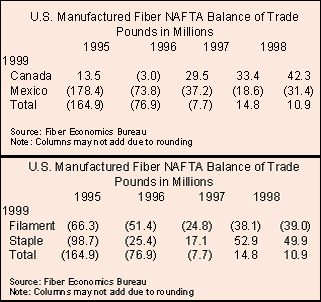
Table 2 outlines the balance of trade in fibers among the NAFTA partners. As the U.S. position in
world fiber trade deteriorated to a 510-million-pound negative balance in 1999, the NAFTA position
continued the positive trend first exhibited in 1995. By adding the data in Tables 1 and 2, one can
calculate the size of trade with non-NAFTA world areas can be calculated. In 1995, it was positive
116.7 million; 1996, positive 108.9 million; 1997, negative 202.9 million; 1998, negative 397.2
million; and 1999, negative 520.9 million. It certainly appears the U.S. fiber industry should be
thankful for the apparent positive benefits of NAFTA trade. NAFTA trade has a distinct geographic
slant, with the United States historically running positive trade balances with Canada and
negative, but decreasingly so, balances with Mexico (See Table 3). Canada apparently has focused
its fiber manufacturing in non-apparel markets, particularly in nylon. In total fiber trade between
the United States and Canada, except for a small negative trade balance in cellulosic filament,
only nylon filament runs a negative trade account, one approaching 100 million pounds annually.
This position reflects a regional approach by producers to fiber production, with much nylon
industrial filament production transferred to Canada since 1990. In polyester, the 800-pound
gorilla of trade, the United States maintains with Canada a small positive trade balance in
filament, while dancing around a zero balance in staple. At the southern end of NAFTA geography,
the trade picture with Mexico is significantly different from that with Canada. Consistent with the
difference in apparel industry wages between the United States and Mexico, Mexican trade in fibers
focuses on apparel-type items, and, not surprisingly, the major emphasis is on polyester. Mexican
polyester filament trade has run a consistent deficit approximating 22 million pounds in the past
five years. Once falling below 100 million pounds, staple has settled into a negative balance of
approximately 75 million pounds. This negative balance may grow as DuPont participates with its
Mexican Alpek alliance in building new capacity and faces issues of productivity in old U.S.
facilities vis-a-vis new operations in Mexico.

ConclusionAccording to the El Paso Report, since NAFTA opened the U.S. market to Mexicos
textiles and apparel goods, overall textiles and apparel exports to the United States have
increased 419 percent. In fact, Mexico surpassed China as the top supplier for the United States
for these products. That is the gauntlet. Mexican wage rates will rise, but so will those in the
United States. The U.S. fiber and fabric industries are as efficient and productive as any in the
world. Creativity, marketing and design abound in the United States. If industry marries the
competencies admits that the United States is a capital-sensitive, large-quantity manufacturer of
fibers and fabrics, and supports Mexicos management of its labor competencies then the natural
forces of cross-border intra-industry trade can be ridden to new records.
Editor’s Note: John E. Luke is owner of Five Twenty Six Associates Inc., Bryn Mawr, Pa., a
consulting firm specializing in strategic marketing and operations facing textile fiber and fabric
manufacturers. He is also a professor of textile marketing at Philadelphia University.
September 2000


