Part one in a two-part series about the technical textiles industry.
By Stephen M. Warner
The year 2015 was a pivotal time for both the U.S. and global technical textiles industries. However, other than in the automotive segment, it was not a particularly exciting year of increases in the end-market segments for technical textiles.
The U.S. economy grew 2.4-percent in 2015, which matched the growth in 2014. What is more worrisome is the lackluster fourth quarter of 2015 and a slow start to 2016. Many economists feel America already is in a manufacturing recession. A stagnant economy spells at least caution for the technical textiles industry. The slowdown in the rest of the world and the strong U.S. dollar also pose a challenge to the domestic textile industry seeking to export.
Many of the factors that will significantly influence the industry for years to come including a pending end to the decrease in military spending, the conclusion of negotiations on a free trade agreement, foreign-owned plant expansions, the passage of a massive commitment to address the crumbling transportation infrastructure and a severe drop in fuel prices.
Military
The U.S. Department of Defense (DoD) funding has been fundamentally shaped by the legally binding cap on appropriations as detailed in the 2011 Budget Control Act (BCA). It required defense spending decreases for fiscal year (FY) 12 through FY21. Frequently, military cutbacks are associated with the term sequestered. This only technically happened though in 2013. It is the threat of sequestering that binds the spending limits. If the spending goes over the actual budget, sequestering takes place, which results in automatic cuts across the board. A subsequent Bipartisan Budget Act of 2013 raised the DoD base budget — the budget for all activities other than those associated with ongoing combat operations in Afghanistan and the Middle East — for FY16 from $523 billion to $548 billion.
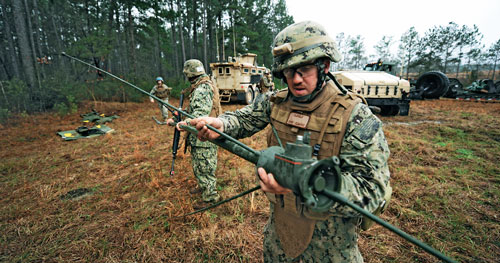
Despite the drastic past three-year reduction, military products remain one of the largest segments for technical textiles. The U.S. Defense Logistics Agency’s (DLA’s) Troop Support’s Clothing and Textile Directorate supplies more than 8,000 different items ranging from uniforms and body armor to tents and ammunition pouches. Table 1 shows a breakdown in the DLA’s actual and anticipated FY14 through FY17 purchasing (in millions).
Even with the BCA limits in FY15, the budget called for an increase in the Individual Equipment Category. But many of the planned purchases did not happen and, most likely, the entire $350 million budget authorization was not used. There was, for example, an anticipation of 190,000 tents and shelters to be procured in the FY15 budget, but a spot check of the numbers through October showed far fewer shelters actually have been ordered.
The military shelter contractors are seeing consolidation and refocus. Business has declined with the military by 40 to 50 percent from just a few years ago. It’s difficult to maintain a viable business with trained employees if one is dependent on military orders. The year 2015 began with eight primary shelter providers:
- Outdoor Venture Corp., Stearns, Ky.;
- Camel Manufacturing Co., LaFollette, Tenn.;
- Hunter Defense Technology (HDT), Solon, Ohio;
- Alaska Structures, Anchorage, Alaska;
- Diamond Brand Canvas Products, Asheville, N.C.;
- Johnson Outdoors Gear Inc. (Eureka), Binghamton, N.Y.;
- CAMSS Shelters, Kirkland, Wash.;
- Anchor Industries Inc., Evansville, Ind.; and
- DHS Technologies LLC, Orangeburg, N.Y.
During the year, Camel was sold to a private equity investor and HDT purchased DHS Technologies, the creator of the DRASH™ — Deployable Rapid Assembly Shelter — shelter system.
Military industry consolidation also hit ballistic vest manufacturers and this even was a noted concern in the report that accompanied the 2016 DoD Appropriations Act. As a result of the defense spending cutbacks, the military has become more creative about working with less funding. One example is the force protection evolution of the ballistic vest. There are an estimated 400,000 of the Improved Outer Tactical Vests (IOTV) in inventory. The changes in camouflage pattern from Universal Camouflage Pattern (UCP) to Operational Camouflage Pattern (OCP) and protective barrier enhancements developed since then have made the vests in inventory outdated. Rather than discard and purchase new vests, which are estimated to be worth $791 per unit, a team from the DLA’s Troop Support has worked on a project over the past several years to convert these non-compliance vests into compliant vests at a cost of $412 each.
By retrofitting, rather than purchasing new vests, the DLA has saved taxpayers an estimated $56 million so far, and the potential overall savings total $150 million once conversion is complete. Good for the taxpayers and the military but, of course it means fewer vests being made by the textile industry. A decade ago, during the height of the Afghan and Iraq conflicts, the U.S. Army ordered 1.7 million IOTV vests. Today, the annual estimated need is 40,000 vests.
Another cost-saving initiative that has an impact on the technical textiles industry is the consolidation of combat uniform camouflage patterns. Prior to 2002, there were two basic combat uniform pattern designs — woodlands and desert — for each of the four service branches. Starting with the Marines in 2002, 10 new distinct patterns were introduced over the next decade, each designed for a specific application within each military branch. The transition to the Universal Camouflage Pattern (UCP) for the U.S. Army alone cost $5 billion. Eight years later, in 2010, the Army again decided to change from UCP to a newer version of the Operational Camouflage Pattern. The transition cost is estimated at another $4 billion. The process began in July 2015, and the Army expects to fully transition by October 2019.
The Government Accountability Office (GAO), investigating the spiraling costs camouflage design, found more than $12 million has been spent developing many of these designs. In a scathing report sent to Congress in 2014, the GAO said: “Although the Army, Air Force, and Marine Corps stated that they have established certain requirement for combat clothing, performance standards were mixed and not specific to the combat environment. The effectiveness of the camouflage was not one of the operational criteria used to measure performance.” GAO estimated that a consolidation of designs for combat uniforms used by all services could save at least $80 million.
Recent increased involvement in Iraq and Syria support has caused an uptick in foreign military sales (FMS) of equipment and combat uniform needs. FMS items include 11,000 sets of desert battle dress uniforms, 12,000 assault packs, 71,000 ammunition pouches and 12,000 grenade pouches. The support likely will increase over the next year.
The Berry Amendment continues to protect the textile markets of products used by the U.S. military and Homeland Security. Three basic factors important in the Berry Amendment are:
- If a product made of textiles can be sourced in the United States, procurement stays in the domestic industry;
- The procurement threshold is $150,000 before the Amendment applies; and
- The amendment does not necessarily apply to certain high-tech products such as chemical protective clothing that may be sourced within some North Atlantic Treaty Organization countries.
Despite these protective measures, improved enforcement is still needed. In August 2015, the U.S. Navy conducted an audit of 55 contracts to determine whether they were compliant with the Berry Amendment and the Buy America Act. Eleven of the 23 contracts worth $73 million were not in compliance with the Berry Amendment, and 12 of 32 contracts worth $1.2 million were not compliant with the Buy America Act. The most common non-compliance cause was because the purchaser was not aware of the requirements.

Transportation
In the United States, a record 17.5 million cars and light trucks were made in 2015 — a 15.7-percent increase over 2014. At an average of 28 square yards of fabric used per vehicle, that’s an increase of 16.8 million yards.
Industry consolidation continues in the airbag supplier industry. A few years ago there were 17 manufacturers of automotive airbags; today, there are only a handful because automotive manufacturers are facing consolidation, as well as requiring them to become global players. In 2015, Livonia, Mich.-based TRW Automotive was acquired by Germany-based ZF Friedrishschefen AG; and in January 2016, Sterling Heights, Mich.-based Key Safety Systems announced it was being acquired by China-based Nigbo Joyson.
The automotive supplier industry tends to cluster around its customer. This is why there has been a burst of composite and nonwoven plant developments and expansions in the southeastern United States as companies such as BMW, Volvo, Volkswagen and Mercedes-Benz locate assembly plants in the region.
In 2015, the global industry estimates were $20 billion for airbags and $9 billion for seatbelts. Looking at 2015, the airbag market situation can be characterized as the good, the bad and the ugly.
The good is that the markets for airbags and seatbelts are growing both because of increased car production and, in the case of airbags, because of the increased number in each vehicle. Airbags now account for almost 19 percent of all automotive textiles according David Hart, PCI Consulting Group. New mandatory safety regulations requiring cars sold in Brazil and India to have airbags now is in place and will be adding a significant increase in the number of airbags used globally. In developed nations, automotive manufacturers strive to receive high safety ratings through programs such as the New Car Assessment Program and this becomes a significant market driver for adding more airbags.
The bad is only bad in the immediate future. A few countries, including the fourth-largest car maker in Mexico, have not made airbags a mandatory safety feature. General Motors CEO Mary Barra recently defended GM’s decision not to include airbags in cars being made for Latin America and it’s a financial decision. Cars with airbags increase the costs by 8 to 10 percent.
The ugly, of course, is the association with recalls as part of the Takata airbag system. The number of vehicles affected is up to an incredible 20 million and growing. Neither the production nor the fabrication of the airbag has anything to do with the actual problem, which is the choice of propellant to inflate the bag, but unfortunately the bag gets a bad rap because of the phrase “airbag system.” As recently as 2014, Takata was estimated to have about a 25-percent share of the airbag market. Its difficulties have put pressure on the other remaining bag manufacturers not only to match the record growth of vehicle manufacturing, but also to make up some of Takata’s lost market share as car makers look elsewhere for a supplier.
Protective Workwear Expansion
According to a recent research report, thermal protection is the major driver in the protective clothing market, followed by visibility and mechanical properties. The flame-resistant (FR) fabrics market can be broadly segmented into apparel and non-apparel.
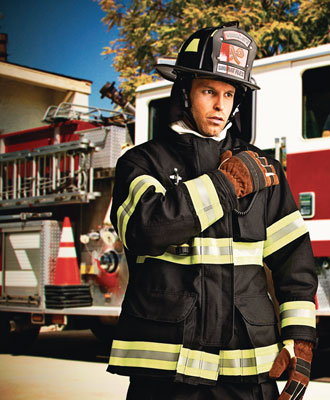
Market research reports stated FR fabrics going into the U.S. protective workwear industry was a $720 million market in 2015. The progression of distinct market penetration has ensured a steady growth of FR workwear over the past few decades. Besides the obvious applications such as firefighter protective equipment, the use of FR garments is seen in the mining, refinery, industrial, petrochemical, healthcare, and utility industries — almost every industry where there is a risk of fire or severe heat. In the last five years, there has been a massive expansion into the oil and natural gas industry.
However, FR workwear growth stalled in 2015 because of the slowdown in oil and gas resource development. More than 129,000 oil and gas jobs were eliminated during the year. Fewer workers equals fewer buyers of FR-treated workwear.
Another market driver is the increased understanding of work hazards such as arc flashing, drilling and dust. Federal agencies such as the Occupational Health and Safety Administration (OSHA) are demanding increased worker protection.
Medical protective clothing can shield medical professionals from harmful pathogens. These garments not only protect medical professionals, but also patients from possible contamination from non-sterile garments. There was a surge in medical protective clothing after the 2014 Ebola crisis. There may be another surge in light of the Zika virus or as other potential pandemics occur.
In addition to the physical protection offered by workwear garments, the other driver for basically all major markets of protective clothing is comfort. The importance of comfort cannot be overstated. Comfort can impact whether workers wear their personal protective equipment. This results in a blending of the fashion and protective industries. Gone are the days of utilitarian work uniform in many cases.
Editor’s note: Stephen M. Warner is publisher of BeaverLake6 Report, beaverlake6.com, a Web-based newsletter reporting on trends, data and issues that he feels influence the technical textiles industry. He also is former president and CEO of Industrial Fabrics Association International. The article is based on Warner’s presentation given at the 2015 Textile World Innovation Forum.
March/April 2016


