The renewed interest in the potential of increasing domestic manufacturing has been spurred by
studies that indicate that such an increase may not be simply a political dream, but could offer
economic advantages. In 2012, co-author B.J. Hamilton conducted a substantial research project that
sought to examine trends in production costs, to determine if conditions are becoming more
favorable for textile manufacturing in the United States. This is the second installment of a
four-part series of papers created from that research.
The main sources of secondary data utilized in this paper are surveys conducted by the
International Textile Manufacturers Federation (ITMF), Switzerland,. The survey reports include the
ITMF International Production Cost Comparison reports (1991-2010) and the ITMF International
Textile Machinery Shipment Statistics reports (1990-2010).
Yarn Spinning Capacity Data
The yearly capacities, in number of spindles, for both ring spinning and rotor spinning are
displayed in Figures 1 and 2. Figure 1 shows that, among the included countries, the United States
had the highest capacity for rotor spinning from 1990 to 2001. After that year, China became the
leader in rotor spinning capacity and continued to increase capacity every year. Meanwhile, US
capacity continued to decline, and in the most recent survey, had less capacity than countries such
as India and Turkey. Figure 2 shows the yearly short-staple ring spinning capacity for each
country. This graph shows a similar trend of Chinese capacity increasing every year beginning in
2001, and having by far the highest capacity in the most recent survey. These patterns reflect the
phasing out of the World Trade Organization (WTO) safeguards that were in place for China during
this time period.
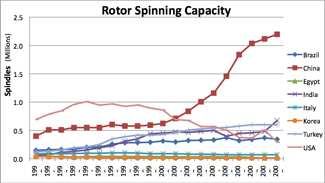
Figure 1: Country Rotor Spinning Capacities By Year
Data Source: ITMF International Textile Machinery Shipment Statistics (1991-2010)
Click here to view Figure 1 in a new window
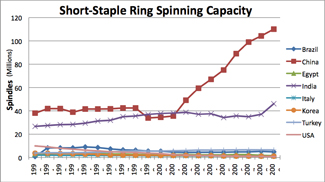
Figure 2: Country Short-Staple Ring Spinning Capacity By Year
Data Source: ITMF International Textile Machinery Shipment Statistics (1991-2010)
Click here to view Figure 2 in a new window
Spinning Cost Trends
Figures 3 and 4 exhibit the time trends of total spinning costs, including the cost of fiber,
for each participating country in the surveys. In both figures, the United States is highlighted
using a bold red line to show its place among the other countries over this time period. Figure 3
shows that for ring spinning, Italy had the highest cost for the entire time period. The United
States began with the second-highest cost, but over the years was surpassed by four other countries
and ended up having the second-lowest cost per kilogram of yarn. Meanwhile, the cost of ring
spinning in China rose to become the clear second-highest behind only Italy. Figure 4 also shows
the rising cost of making yarn in China, this time for rotor spinning. The United States was
already one of the less expensive countries in 2003, but the gap between it and China widened over
the years. This trend is extremely important to the future of the U.S. textile industry. American
companies already have certain location advantages, and any cost advantage gives U.S. customers
even less reason to import textile products. Opportunity is coming to the United States because
worldwide costs are rising at a faster rate.
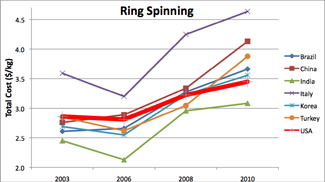
Figure 3: Country Ring Spinning Costs By Year
Data Source: ITMF International Production Cost Comparison (2003-2010)
Click here to view Figure 3 in a new window
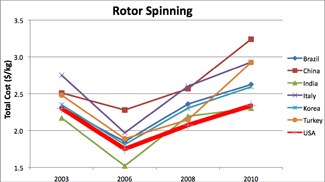
Figure 4: Country Rotor Spinning Costs By Year
Data Source: ITMF International Production Cost Comparison (2003-2010)
Click here to view Figure 4 in a new window
Components Of Spinning Cost
The cost of spinning in each country was further broken down in the surveys into the cost
components of raw material, interest, depreciation, auxiliary material, power, labor and waste.
This breakdown was useful because it allowed for the impact of an increase in a particular cost
driver to be analyzed. For the sake of brevity in this paper, only the results for ring spinning
are shown below, but rotor spinning costs followed similar trends. In fact, according to Hamilton,
the labor component is even less of an issue with rotor spinning compared to ring spinning because
there is a higher degree of automation in rotor spinning.
Figure 5 shows the total cost of ring spinning for each country in 2010, broken into cost
components. A bold red line is placed on the top of the U.S. bar in order to gauge its cost
relative to the other countries. This figure shows that the United States has the second-lowest
total cost and that raw material is the largest cost driver for each country. Figure 6 shows what
the total cost for each country would become if the raw material cost were doubled, a situation
that has precedence in the 2010-11 elevation of cotton prices. The United States remains the
second-least expensive; however, the gap between it and some of the more expensive countries — such
as China, Egypt, and Italy — has widened, with several of the countries now being a full dollar per
kilogram higher. India has gained a similar advantage and remains less costly than the United
States. Power is another cost component for which a uniform increase might be advantageous to the
United States, This, of course, assumes a uniform global increase in costs; naturally, regional
variations would give slightly different results.
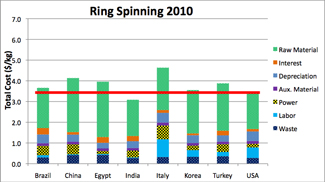
Figure 5: Cost Components Of Ring Spinning
Data Source: ITMF International Production Cost Comparison (2010)
Click here to view Figure 5 in a new window
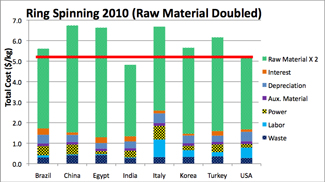
Figure 6: Cost Components Of Ring Spinning (Raw Material Doubled)
Data Source: ITMF International Production Cost Comparison (2010)
Click here to view Figure 6 in a new window
Conclusions
This paper shows that the United States, while losing worldwide share in yarn production, has
been slowly gaining in global cost competitiveness in both ring and rotor spinning. Additionally,
the cost structure of U.S. yarn spinning provides the opportunity for the United States to benefit
from global increases in fiber prices. This would seem to open up the opportunity for the United
States to reclaim some of its lost manufacturing capacity in the spinning area because the cost of
producing yarns in the United States is lower than for most competitors.This advantage would also
carry with it the benefits of higher quality, shorter time to market and potential for
collaborative arrangements with fabric producers. Recent announcements, such as international
textile company Gildan Activewear Inc.’s plans to build a large new ring-spinning facility in the
United States, seem clearly to support these conclusions.
References
Bethea, A. (2012). “Yarn-spinning facility,170 jobs, headed to Rowan.” The Charlotte
Observer. Dec. 19, 2012. Retrieved from:
http://www.charlotteobserver.com/2012/12/19/3736225/yarn-spinning-facility-170-jobs.html
Hamilton, B.J. (2012). “Short- and Long-Term Opportunities for US Textile Manufacturing.”
PhD Dissertation, North Carolina State University.
ITMF. (1990-2010). International textile machinery shipment statistics.
ITMF. (1991, 1995, 1997, 1999, 2001, 2003, 2006, 2008, 2010). International production cost
comparison: Spinning, texturing, weaving, knitting.
Editor’s note: Brian John Hamilton, Ph.D., is product developer – Domestic Lifestyle at New
Balance Athletic Shoe Inc., Boston. William Oxenham, Ph.D., is Associate Dean, and Kristin Thoney,
Ph.D., is Associate Professor at North Carolina State University’s College of Textiles, Raleigh,
N.C.
April 16, 2013