Pore volume, pore diameter, pore volume distribution and pore throat diameters of nanofiber mats were measured using mercury intrusion porosimetry, liquid extrusion porosimetry and capillary flow porometry.
By Sudhir Sharma
Nanofiber nonwovens are finding increasing applications in filtration industry particularly in processes involving biotechnology. For such applications, pore volume is very important. Through pore diameter, pore throat diameter and permeability are also important pore structure characteristics.
Nanofiber mats are normally sensitive to pressure and are often brittle. Therefore, the characterization technique should be such that the pore structure is not distorted. In this investigation, the applicability of the techniques, Mercury Intrusion Porosimetry, Liquid Extrusion Porosimetry and Liquid Extrusion Flow Porometry for pore structure characterization of nanofiber mats have been investigated. The results obtained by the three techniques have been critically examined.
Characterization Technique: Mercury Intrusion Porosimetry
Mercury is non-wetting to most materials. It does not enter the pores spontaneously. Intrusion of mercury into pores occurs due to pressure applied on mercury. Pressure is used to compute pore diameter1:
D = – 4γ cos θ/p
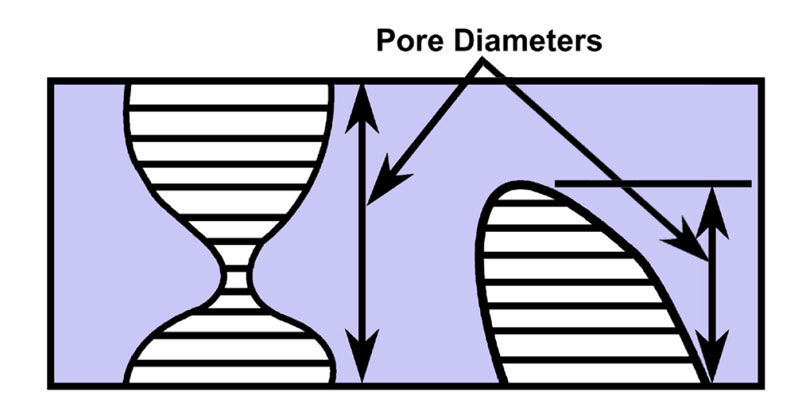
where D is pore diameter, γ is surface tension of mercury, θ is contact angle of mercury and p is pressure on mercury for intrusion into the pore. Intrusion volume gives pore volume. The technique measures pore volume and pore diameter of through and blind pores. As shown in Figure 1, all diameters and volumes of through and blind pores are measured.
Characterization Technique: Liquid Extrusion Porosimetry
In liquid extrusion porosimetry, the pores are spontaneously filled with a wetting liquid and the liquid is extruded from pores by a non-reacting gas. It can be shown that the differential pressure is related to pore diameter2,3:
D = 4 γ cos θ/p (2)
where D is pore diameter, γ is surface tension of wetting liquid, θ is the contact angle of the wetting liquid and p is differential pressure.
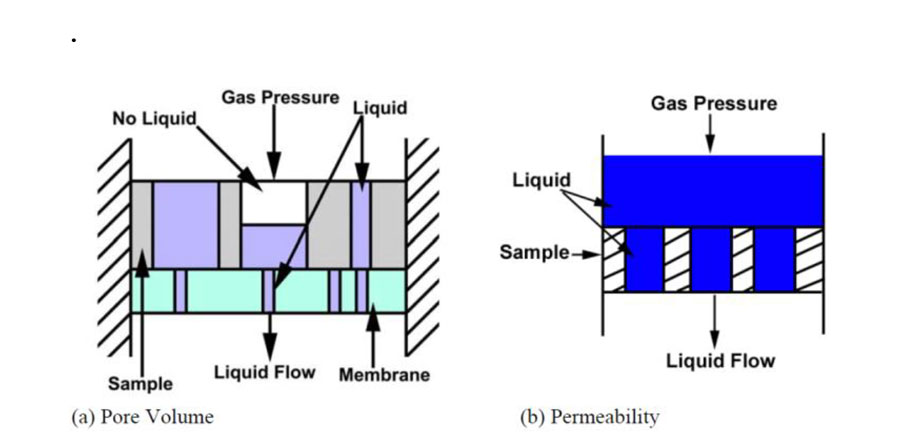
In this method, the volume of extruded liquid is measured in addition to the differential pressure. In order to allow the extruded liquid to flow out and prevent the gas to escape, a membrane is placed under the sample such that the largest pore of the membrane is smaller than the smallest pore of interest in the sample (see Figure 2a). The pores of the sample and the membrane are filled with a wetting liquid and pressure on gas is increased to displace the liquid from pores of the sample. The gas pressure is inadequate to empty the pores of the membrane. Therefore, the liquid-filled pores of the membrane allow the extruded liquid from the pores of the sample to flow out while preventing the gas to escape. The measured volume of the liquid flowing out of the membrane gives through pore volume. Differential pressure yields through pore diameter and variation of volume with pressure yields through pore surface area. Flow rate of excess liquid maintained on the sample yields liquid permeability (see Figure 2b).
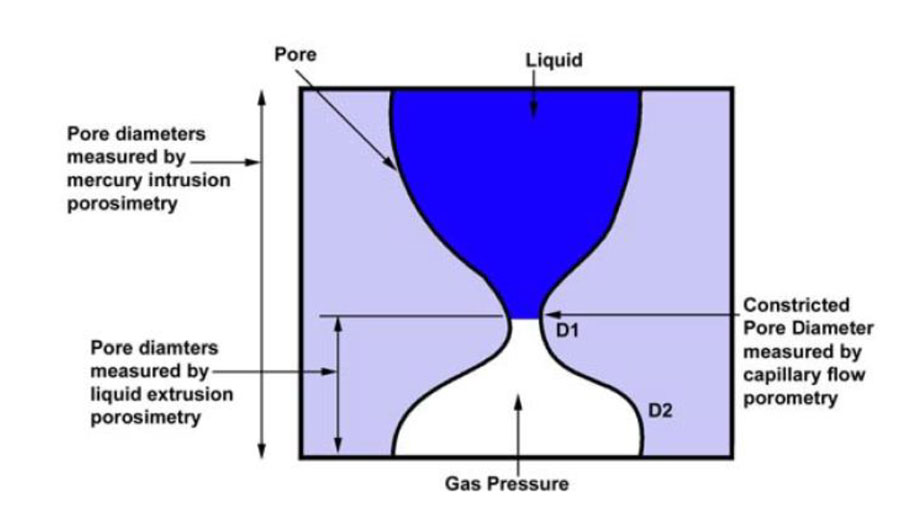
This technique measures only the volume and diameters of through pores (see Figure 3) 3. Blind pores are not measured. As shown in Figure 3, only some of the diameters of the through pore are measured, whereas mercury intrusion measures all pore diameters.
Characterization Technique: Liquid Extrusion Flow Porometry/Capillary Flow Porometry
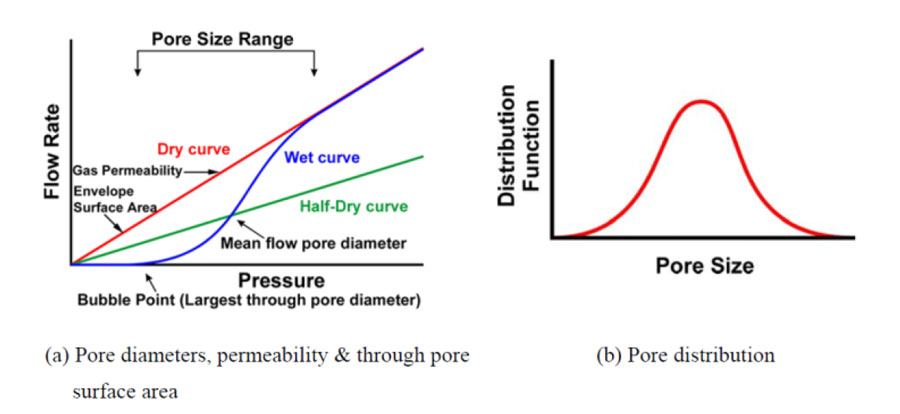
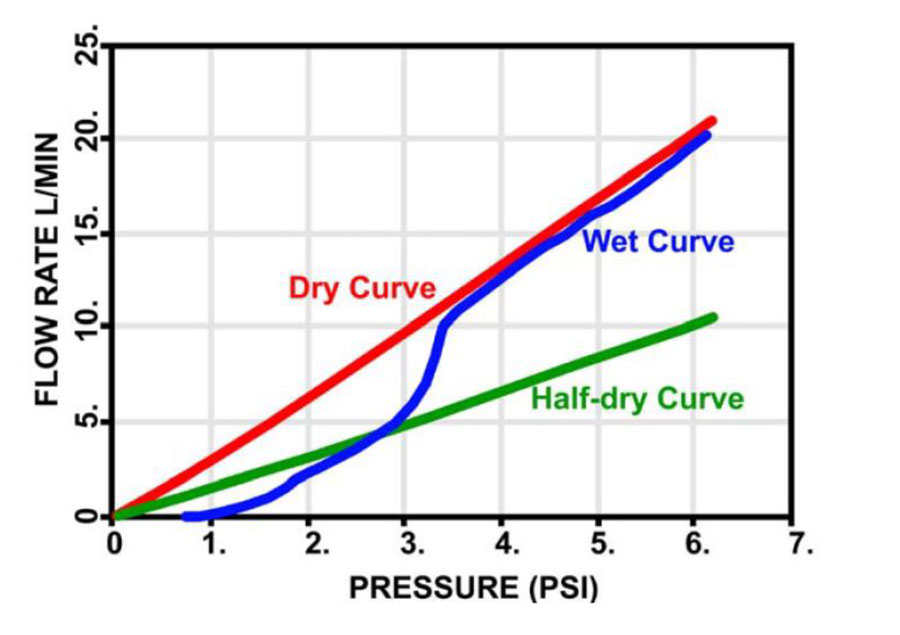
In this method, the pores of the sample are filled with a wetting liquid, the liquid is emptied by a pressurized gas permitting gas to flow through the empty pores. The differential pressure required to empty a pore of diameter D is given by Equation 21,4. It shows that the largest pore is emptied at the lowest pressure and initiates gas flow. With increasing pressure smaller pores are emptied and gas flow increases. The differential pressures and gas flow rates through dry and wet samples are measured. In the dry sample, the flow rate increases with increase in pressure. In case of the wet sample, initially there is no flow because all the pores are filled with the liquid. At a certain pressure the gas empties the largest pore and gas flow starts through the wet sample. With further increase in pressure smaller pores are emptied and the flow rate increases until all the pores are empty and the flow rate through the wet sample is the same as that through the dry sample. This is schematically illustrated in Figure 4. The half-dry curve in this figure is computed from the dry curve to yield 50 percent of flow through dry sample at the same pressure. The dry and wet curves yield the bubble point, the mean flow pore diameter, flow distribution and pore fraction distribution of through pores. The dry curve yields gas permeability and envelope (through pore) surface area. Liquid flow rate gives liquid permeability.
Capillary flow porometry measures only the throat diameter of each through pore. One diameter per through pore is measured. Blind pores are not measured.
Results And Discussion: Through Pore Volume
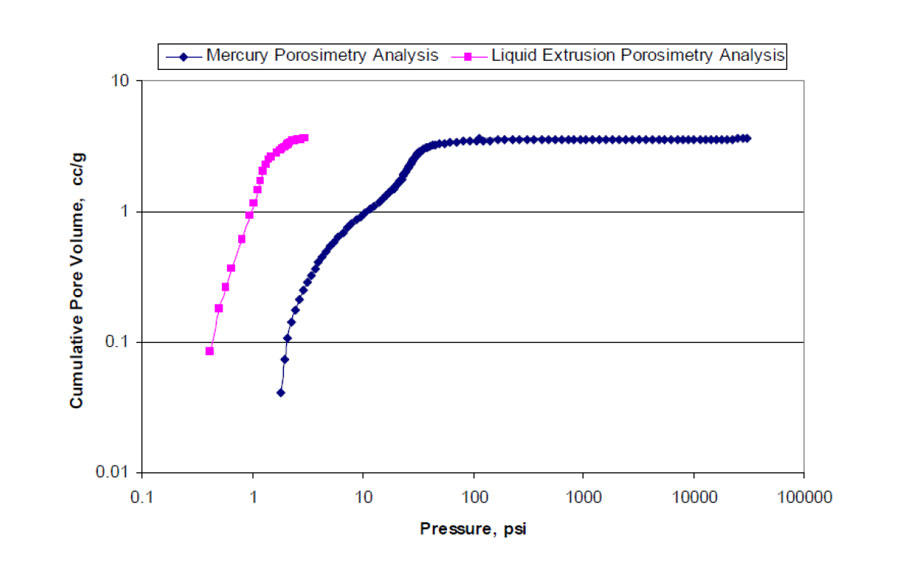
Mercury Intrusion Porosimetry yields volume of through and blind pores as a function of intrusion pressure. However, nanofiber mats are not expected to contain appreciable amounts of blind pores. Therefore, the measured intrusion volume is due to the volumes of through pores. Extrusion porosimetry measures only the through pore volume as a function of extrusion pressure. The pore volumes measured in both techniques are shown as function of pressure in Figure 5.
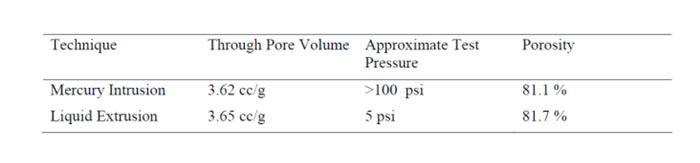
The total pore volumes measured by both techniques are the same (see Table 1). This observation confirms that the blind pores in the nanofiber mats are negligible. However, the measurement pressure for mercury intrusion is almost twenty times higher than the test pressure required for liquid extrusion. The high test-pressure for mercury intrusion is likely to distort the pore structure of nanofiber mats.
Porosity
Blind pores in the nanofiber mat are negligible. Therefore, porosity of the nanofiber mat is computed from the measured pore volume and bulk density of the material. As expected, porosity is high for the nanofiber material. Both techniques yield the same value (see Table 1).

Pore Diameter
Figure 6 shows a plot of pore volume against pore diameter measured by mercury intrusion porosimetry and liquid extrusion porosimetry. Pore volume of wide pores measured by liquid extrusion is less than the pore volume of wide pores measured by mercury intrusion. But pore volumes of small pores measured by liquid extrusion are larger than those measured by mercury intrusion. Such behavior is expected. As explained above, the diameters and volumes of wider parts of a wide mouth pore beyond the throat are not measured by liquid extrusion porosimetry, but the volumes of these parts of the pore are measured as the volume of the small pore of constricted diameter. Therefore, volume of large pores measured by liquid extrusion is smaller and volume of small pores measured by liquid extrusion is larger than the volumes measured by mercury intrusion.
High intrusion pressure of mercury can also shift the mercury intrusion curve relative to the liquid extrusion curve by distorting the pore distribution. Before mercury intrusion could start, the pressure of mercury can compress the sample and measure intrusion volume due to volume reduction of the sample by compression. Thus, mercury intrusion will show higher intrusion volume when the pores are large. With increasing mercury pressure smaller pores will be reduced in diameter. Although, the volume reduction by compression of the sample is measured as the pressure goes up, the volume of smaller pores are not measured. Therefore, volume of small pores measured by mercury intrusion will be smaller than the volume measured by liquid extrusion.
Liquid extrusion and mercury intrusion techniques do not give the pore throat diameter, the largest pore throat diameter and the mean flow throat diameter of the nanofiber mat. Capillary flow porometry is capable of such measurements. The results obtained with capillary flow porometry are shown in Figure 7.
The largest pore throat diameter (bubble point pore diameter) and the mean flow pore diameter computed from the data in Figure 8 are 12.50 and 3.36 μm respectively. Figure 7 shows that the test pressure for this technique is also very low so that the influence of pressure may be taken to be negligible.
Pore Volume Distribution
The pore volume distribution over pore diameter is expressed in terms of the distribution function Fv:
Fv = – (dV/d log D) (3)
where V is pore volume. The function is such that area under the function in any pore diameter range yields volume of pores in that range. Figure 8 shows the pore volume distribution computed from data in Figure 6 based on mercury intrusion and liquid extrusion.
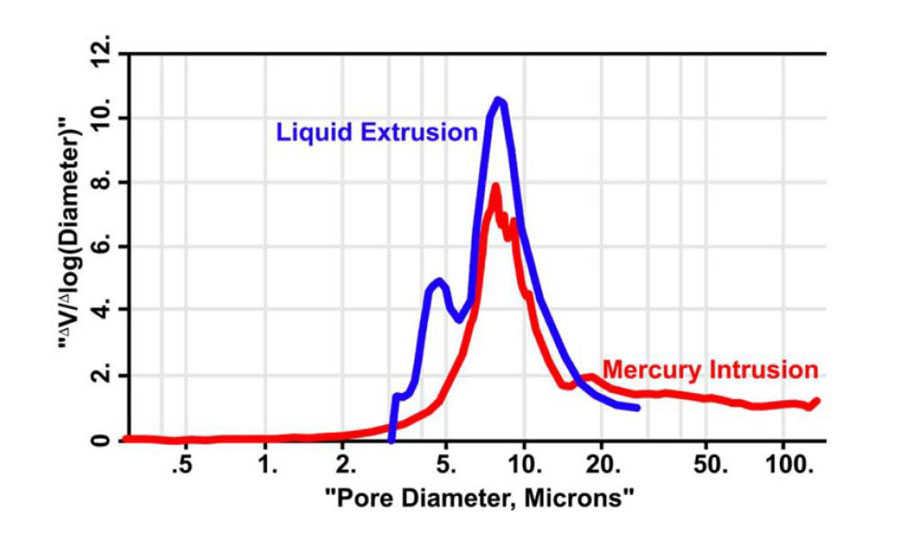
Mercury intrusion yields only a single peak whereas liquid extrusion yields two peaks. The first peak represents about 75 percent of pore volume and the second peak represents about 25 percent of pore volume. Thus, the resolution is much higher in liquid extrusion. In this technique, smaller pores are more easily detectable because volume of pores beyond the pore constriction is associated with the constricted pore diameter.
As shown in Figure 8, the smaller pores are not seen by mercury intrusion because of the high pressure. With increase in pressure, mercury enters large pores and reduces the diameters of small pores by compressing them. Thus, the peak due to the small pores is suppressed. The flow distribution is expressed in terms of distribution function F:
F = – [(Fw/Fd)×100] /dD (4)
Where Fw and Fd are flow through wet and dry samples respectively. The function is such that area under the function in any pore diameter range is the percentage flow in that range. Figure 9 shows the flow distribution over pore diameter computed from data in Figure 7. The peak of the flow distribution curve is at 2 μm. Characteristics of distributions are listed in Table 2.

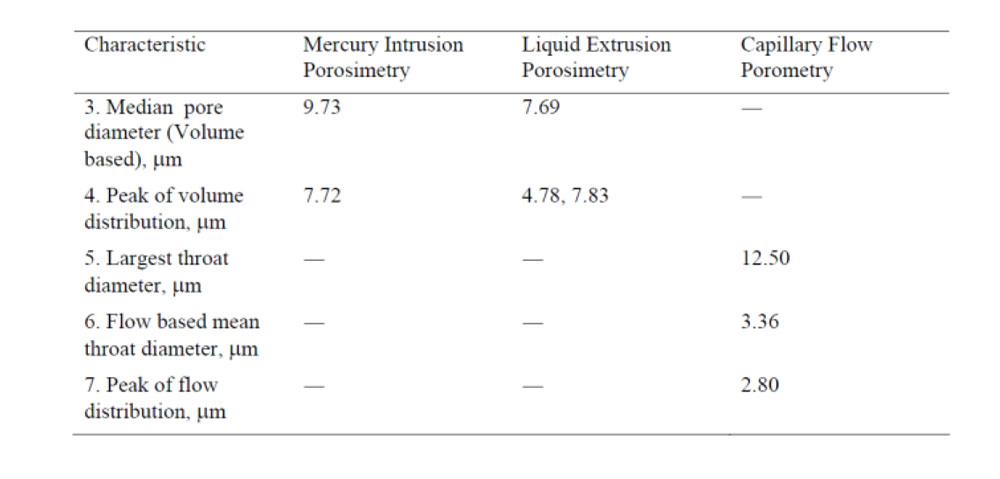
Mercury intrusion yields a larger median pore diameter because the pore volume of large pores measured by mercury intrusion is larger than that measured by liquid extrusion. The volume distribution peak at 4.78 μm is completely suppressed by mercury intrusion. The bubble point diameter is similar to the median pore diameter suggesting that the widest parts of pores are not much larger than the median value. The mean throat diameter and the throat diameter corresponding to the distribution peak are close to the volume distribution peak at 4.78 μm.
Appropriate Technique For Characterization Of Nanofiber Mats
Through pore volume of nanofiber mats can be measured by liquid extrusion porosimetry and mercury intrusion porosimetry. However, mercury intrusion requires high pressures. High pressures reduce pore diameter and further increase in pressure is required to measure the smaller pores. Thus, pore diameters relevant for application are not measured. Pore distribution is suppressed. Peak due to smaller pores is not observed. On the other hand, liquid extrusion requires very little pressure — about 5 percent of the pressure needed for mercury intrusion — produces excellent resolution of peaks and yields the same total pore volume as mercury porosimetry. In addition, liquid extrusion technique is capable of measuring liquid permeability and surface area of through pores, which are important for attachment. Mercury intrusion cannot measure these properties. Therefore, liquid extrusion technique is undoubtedly more appropriate for characterization of pore volumes of nanofiber mats.
For filtration and tissue growth applications, pore throat diameters of nanofiber mats are required in addition to pore volume. Mercury intrusion and liquid extrusion techniques cannot measure pore throat diameter. Capillary flow porometry measures pore throat diameters without distorting pore structure because this technique uses low pressures. Therefore, capillary flow porometry is a good technique to use along with liquid extrusion technique when nanofiber mats are used for filtration applications.
Summary And Conclusion
- Mercury intrusion porosimetry, liquid extrusion porosimetry and capillary flow porometry were used to characterize nanofiber mats. Through pore volume, pore diameter, volume distribution and pore throat diameters were measured.
- Analysis of results showed that both mercury intrusion and liquid extrusion yielded the same total pore volume and porosity, but pore diameter and distribution were distorted by high pressure applied during mercury intrusion. The pore diameters relevant for application were not measured. Liquid extrusion technique did not have these disadvantages and had much higher resolution. The peak due to small pores was clearly seen
- Liquid extrusion technique is the appropriate technique for testing nanofiber mats.
- Capillary flow porometry cannot measure pore volume, but uses low pressures and measures pore throat diameters, which are not measurable by liquid extrusion or mercury intrusion. This is the appropriate technique to support the liquid extrusion technique diameter is similar to the median pore diameter suggesting that the widest parts of pores are not much larger than the median value. The mean throat diameter and the throat diameter corresponding to the distribution peak are close to the volume distribution peak at 4.78 μm.
References
- Akshaya Jena and Krishna Gupta, “Characterization of Pore Structure of Filtration Media,” Fluid particle Separation Journal, Vol. 14, No. 3, 2002, pp. 227-241.
- A. Jena and K. Gupta, “A Novel Technique for Pore Structure Characterization without the Use of Any Toxic Material,” Nondestructive Characterization of Materials XI, Eds. R. E. Green Jr., B. B. Djordjevic and M. P. Hentschel, Springer, 2002, pp. 813-821.
- Akshaya Jena and Krishna Gupta ‘Liquid Extrusion Techniques for Pore Structure Evaluation of Nonwovens,” International Nonwovens Journal, Fall 2003, pp. 45-53.
- K. Jena and K. M. Gupta, “In-Plane Compression Porometry of battery separators,”Journal of Power Sources, Vol. 80, No. 1-2, 1999, pp. 46-52.
- Jena, Akshaya and Gupta, Krishna, “Accuracy and Reproducibility of Pore Size Determined by Flow Porometry” presented at The 14th Annual Technical Conference, The American Filtration & Separation Society, May 1-4, 2001, Tampa, Florida .
- Jena, Akshaya and Gupta, Krishna, “Measurement of Pore Volume and Flow Through Porous Materials,” Materials Testing: MP Materialprufung, Jahrg. 44, pp.243-245, 2002.
Editor’s Note: Sudhir Sharma works for Ithaca, N.Y.-based Porous Materials Inc. The company manufactures novel platforms for testing porous materials including nanofiber nonwovens.
October 22, 2020


