The Balance Shifts
Increased capacity in Asia threatens world fiber production stability. Information
recently received from the Fiber Economics Bureau (FEB) clearly points out the increasing
concentration of fiber-producing facilities in Asia. A comparison of actual production and
projected capacity intentions for eastern Asia can uncover some interesting clues about the
direction of fiber and textile businesses, particularly for apparel, in the region.The evolution of
imported textile materials from Asia is reaching a conclusion. Government and industry cooperation
has created a regional powerhouse industry, whose production ranges from man-made fibers to
complement the ready availability of regional cotton, to fabrics of all descriptions, all focused
on support of traditional labor-intensive garment manufacture throughout the entire region. The
past 10 years have seen a dramatic change in fiber plant siting, as traditional Japanese and
Taiwanese plants play a less active role and are supplanted by dramatic increases in production in
several mainland Asian areas. Fiber GeographyIn this report, Asia is defined as follows:
Central Asia China and Hong Kong; Northeast Asia South Korea, Taiwan and Japan; Southeast Asia
Indonesia, Malaysia, the Philippines, Thailand, Myanmar, Singapore and Vietnam; and West Asia
India, Pakistan, Bangladesh and Sri Lanka.

Table 1 details the changing geography of world man-made fiber production. Man-made
cellulosics are not included, not because their consumption is unimportant, but rather because
their market position is static and not a meaningful part of current Asian fiber capacity
ambitions.It quickly is apparent that major shifts in fiber production and capacity are underway.
Asias share of total world fiber productive capacity, in pounds, has risen to almost 69 percent,
and actual production has matched this rise. In 1998, Asian production represented 64.1 percent of
total world production. By 2001, Asian production had risen 15 percent, 7.5 billion pounds, to 68.1
percent of the world total. More interesting, however, is the production rise in China, almost
doubling from 9.7 billion pounds to 16.1 billion. Chinas share of Asian production rose from 29.6
percent in 1998 to 40.1 percent in 2001 representing the entire Asian market share increase.
Putting this in a broader perspective, Chinese production rose from 18.9 percent of the worlds
supply in 1998 to 27.3 percent in 2001. As might be expected, the primary losers were South
Korea and Japan. Korea finally has slowed building fiber-producing capacity and, in so doing, has
lost share to the expansion binge in China. Koreas share shrank from 16.4 percent of Asian
production (10.5 percent of world) in 1998 to 13.5 percent (8.9 percent of world) in 2001.
Similarly, Japan, a former world fiber power, now produces a modest 1.3 billion pounds of fiber in
an industry with capacity to produce almost 1.9 billion. Japans fiber operating rate languishes in
the high 60s to low 70s range, a formula for disaster. Total Asian apparent operating rates are not
much better, settling in the high 70s, traditionally a marginally profitable experience.
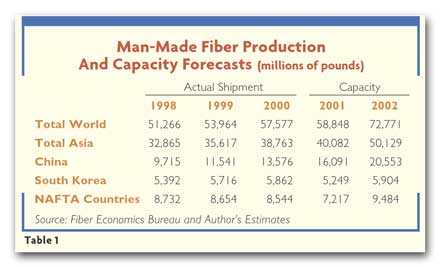
As seen in Table 1, the North American Free Trade Agreement (NAFTA) nations have fared
about as well as Korea in the world fiber sweepstakes. North American fiber shipments represented
17 percent of world shipments in 1998, dropping to 12.3 percent in 2001. Unfortunately, while
shipping approximately 7.5 billion pounds annually, the North American fiber industry is saddled
with almost 9.5 billion pounds of capacity. This translates to an average operating rate of just
under 80 percent possibly, but not assuredly, profitable.The interesting statistic underlying these
geographic descriptions is an analysis of product emphasis, particularly that of filament and
staple polyester. Of 1998 world production of 51,266 million pounds, 36,461 million (52.9 percent)
were filament and staple polyester. Asia shipped 27,095 million pounds, almost 75 percent of world
polyester shipments. By 2001, Asian shipments of polyester totaled 33,764 million pounds, 57.4
percent of total world fiber shipments and almost 80 percent of world polyester shipments.The
picture is clear. Chinese planning focuses on concentrating manufacturing in apparel for the U.S.
market and is building capacity, particularly for polyester, at all levels of distribution in an
effort to dominate this market area. By supplying fibers, fabrics and garments, China retains the
value added by labor at each step of the production process. This virtually guarantees the country
will accumulate substantial quantities of hard currencies, such as dollars, to be spent in
modernizing other areas of the Chinese economy. Mill ConsumptionIn addition to portraying the
Asian textile economy by analyzing fiber shipment, a valuable adjunct to this analysis is a look at
mill fiber consumption. Not surprisingly, mill consumption data paint a similar portrait of the
growing importance of fibers, fabrics and garments to Asian economies.Table 2 analyzes two areas of
the Asian textile economies: Central Asia and Northeast Asia. These areas show the two divergent
directions in which the Asian textile economy is headed apparent total dedication to a fully
vertical industry in developing states, balanced by decreasing emphasis in the developed states as
they metamorphose from labor/manufacturing to capital-sensitive/service/knowledge economies. The
time frame of the analysis stretches back to 1994 for a perspective on growth and change.
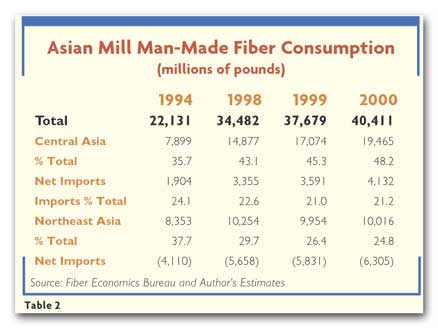
Traditional competitors, the Japanese, Koreans and Taiwanese of Northeast Asia, have
moved up the scale of economic industrialization, wherein labor plays a lesser role in economic
activity. Consider these three states. In 1994, mill consumption of man-made fibers totaled 8,353
million pounds, and fiber manufacturers net-exported an additional 4,110 million pounds. Northeast
Asia obviously was a substantial producer of fabrics and a large exporter of fibers. In six years,
mill consumption rose a modest 3+ percent, compounded annually, to 10,016 million pounds, on top of
which fiber producers exported another 6,305 million pounds. Investment obviously was put to
capital-sensitive fiber plants for worldwide product distribution, rather than national retention
for fabric and garment manufacture. Contrarily, in the same time frame, Central Asia, represented
by China and Hong Kong, more than doubled mill consumption from 7,899 million pounds in 1994 to
19,465 million pounds in 2000. Of 1994 consumption, more than 24 percent was produced from imported
fibers. By 2000, the absolute level of pounds imported for consumption had more than doubled, from
1,904 to 4,132 million pounds. Despite this growth, imports share of mill consumption fell from a
24.1-percent share in 1994 to a 21.2-percent share in 2000. Investment obviously focused on
downstream fabric and garment-making activities, employing more labor and exporting products to
accumulate or conserve strong currencies. Rate Of Change

If history repeats itself, one can expect continued disinvestment in the textile and apparel
economies of Northeast Asia and continued increased investment in the relatively undeveloped
economies of Central Asia. This is a quite normal appearance of the traditional development curve
for economies. What is surprising is the rate of speed at which this maturation has occurred.
Similar development took the United States several centuries; it seems that the Chinese want to
accomplish the same jump in only several generations. Can they do itAs the target of Chinas
manufacturing explosion, can the United States sustain the current orgy of consumer spending
necessary to provide adequate markets Or, maybe more important is the issue raised in these pages
two months ago
(See Fibers Fast Track, TW, September 2002). Will the U.S. textile and apparel complex use
its technology, marketing and distribution expertise to expand the United States presence in
non-Asian international apparel and textile markets
November 2002